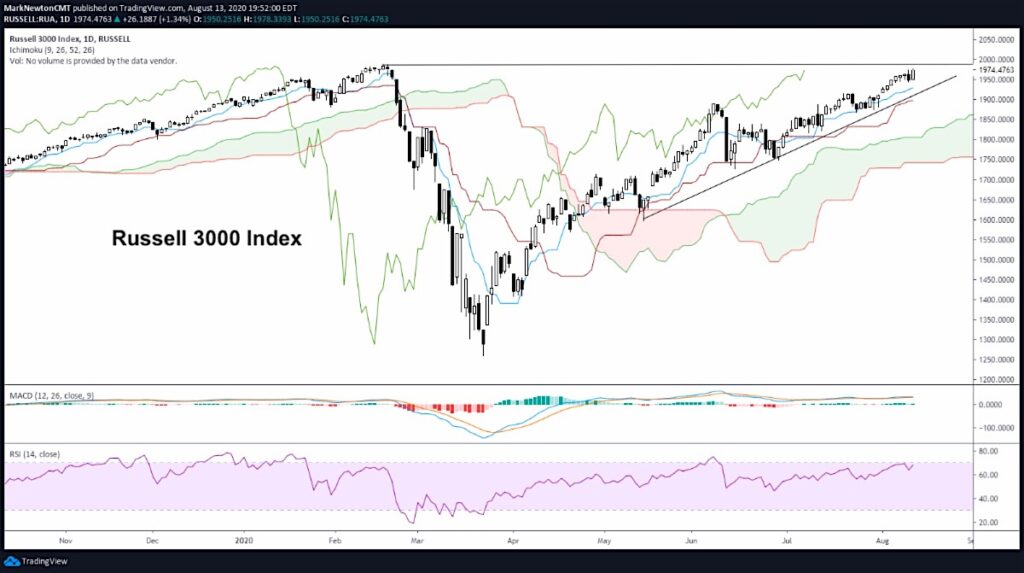
Russell 3000 Index Stock Chart
The Russell 3000 Index is nearing all-time highs, a level which takes on quite a bit of importance given the March correction.
The first meaningful retest of all-time highs given that more than a 40% rally happened since March likely means that this area will serve as important and strong resistance.
As well, investor sentiment has gotten more positive into a seasonally bearish time, meaning that prices can stall out between now and early September.
The risk/reward has gotten much worse on a 1-2 month basis with Sept/October directly ahead.
Broad Market Insights
Heading into the end of the second week of August, the markets aren’t making much progress.
The S&P 500 fell shy of all-time highs, while the Growth trade continued to reassert itself with some above-average participation in Technology.
That said, market breadth was nearly 2/1 negative and we continued to see some “backing and filling” in many of the sectors which had showed the greatest strength over the last couple weeks up until Tuesday..
For instance, both Industrials and Financials were particularly hard hit, while Energy also dropped nearly 2% on the day. Both Technology and Communication Services were the leaders, yet most of XLC is made up of Facebook and Alphabet by weight. So, yet again it’s important to understand the composition of what’s in these ETF’s and what’s actually moving in the market.
Sentiment polls released Thursday actually showed Bulls finally starting to gain some momentum by the “Individual investor” as per AAII’s reading back up over 30% Bulls. This is the highest since January and seems important given that Institutional sentiment has been constructive for some time. Indeed, most Twitter Bears have been shouting bullish sentiment stats for the last month which all largely concern institutions.
However, as I’ve found, it’s a MUST for individual sentiment to also line up before making any bold sentiment call. Given a slow to rebound economy, heightened US/China Tension, ongoing civil unrest while political uncertainty and anger seems to be gripping this country, many people just don’t SEEM all that bullish right now. From my perspective and anyone living on the East coast, the hurricane Isaias ripping up the coast last week caused quite a bit of damage, outages and frustration that only seem to add to the dour mood.
Thus overall, while we’ve seen two straight lackluster if not negative breadth sessions and Tech has begun to “stand alone” yet again, it seems increasingly likely that former highs likely serve as a pretty effective near-term roadblock to gains.
The next 4-6 weeks, if my thinking is correct regarding a combination of Cycles, breadth and momentum divergences, return to Defensive trading and formidable resistance (February highs for SPX and Russell 3k) prove to come together, then Equity markets should be within 1-2 weeks of at least a good trading top. One should consider not being as aggressive entering this seasonally bearish time of the year, but rather, awaiting signs of weakness into late September to buy into. For now, trends are bullish and we’ll stick with this, until trendlines are properly violated and/or Demark indicators line up with cyclical dates for a possible turn on or around mid-next week.
If you have an interest in seeing timely intra-day market updates on my private twitter feed, please follow @NewtonAdvisors. Also, feel free to send me an email at info@newtonadvisor.com regarding how my Technical work can add alpha to your portfolio management process.
Twitter: @MarkNewtonCMT
Author has positions in mentioned securities at the time of publication. Any opinions expressed herein are solely those of the author, and do not in any way represent the views or opinions of any other person or entity.


