The past few weeks have seen the whisper of a 2019 recession grow into something arguably much louder than a whisper.
The U.S. 10-year bond yield has been declining for much of the past year from over 3.0% to 2.06% as of Friday morning (June 7) after a soft U.S. jobs report.
The yield curve, measured by 10-year and 3-month relative yields, has been inverted now for 12 days.
Global bond yields, which were low in May, have continued to move lower. We think it is safe to say the bond market appears to be jumping up and down, indicating there is a rising risk of recession in the near term.
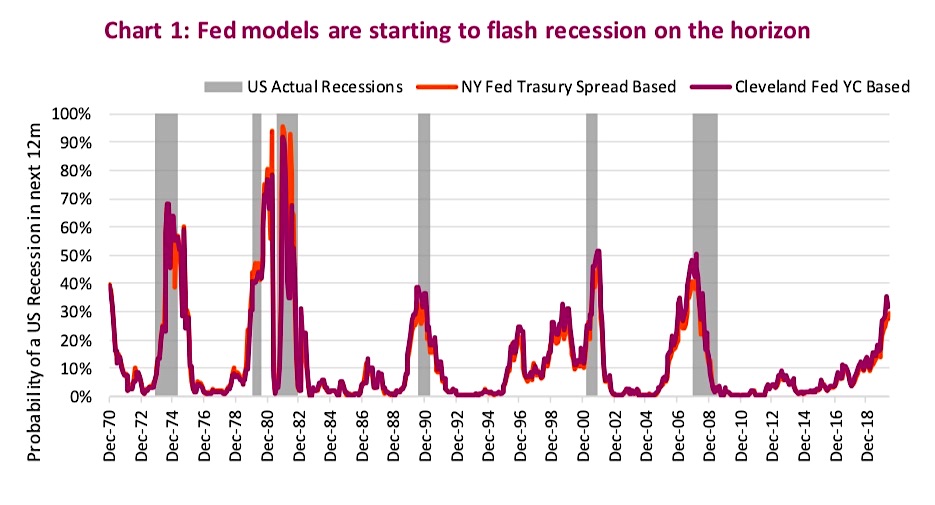
Adding to this chorus are the U.S. Federal Reserve’s recession probability indices. The Federal Reserve Bank of New York (NY Fed) uses Treasury spreads while its counterpart in Cleveland monitors the yield curve slope, meaning both are bond-market sensitive.
In the past, looking at just one part of the market could be misleading. Nonetheless, both of these probabilities are now reading higher than any past false-signal levels, just by a little though.
One of the other problems with trying to time or forecast a 2019 recession is we often don’t know we are in one until months or quarters after it has started. The very definition of a recession, usually two consecutive quarters of negative GDP growth, means that you won’t know the second quarter is negative until about a month after it has concluded.
So, that means the soonest you would know officially about a recession is seven months after it has started (two quarters plus a month, given the delayed release of data). We would hazard a guess that is way too late to be tilting your asset allocation to become more defensive. Plus, GDP also gets revised a number of times after its initial release.
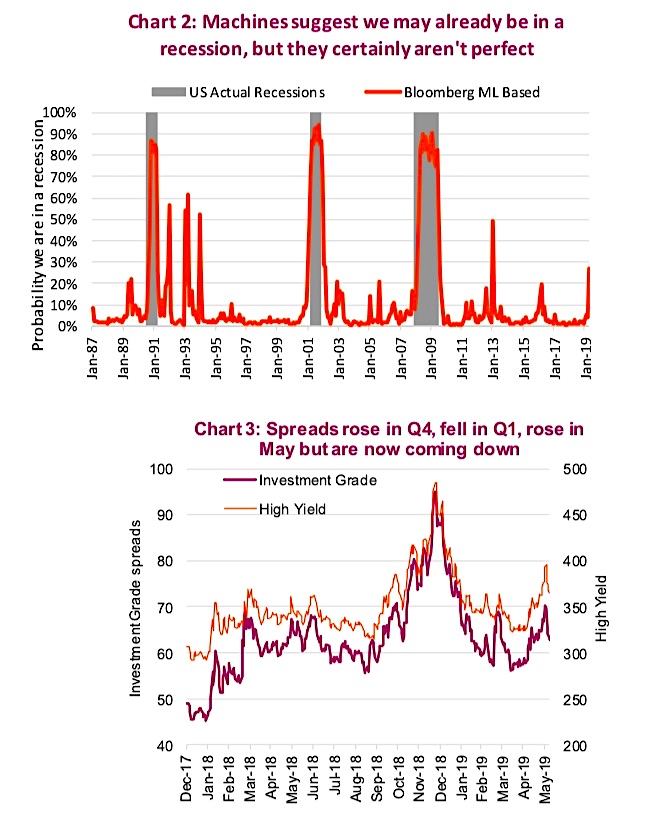
One index that Bloomberg has created is slightly different. It doesn’t focus on the probability of a recession in the next 12 months, but considers the probability that the U.S. is already in a recession. Bloomberg uses a machine learning model (Shane, one of our former quant analysts would be proud) that takes into account GDP values, payrolls, industrial production, manufacturing, trade and personal income. This index is now reading a 27% probability that the U.S. is already in a recession, as of the end of April. Given recent data, you can bet this is going to 0% climb higher.
It is worth noting that this index isn’t conclusive – it does give some false signals, most recently in 2013 and in early 2016. And upon closer inspection, it indicated low probabilities when some recessions had already started: 8% in the 2008 recession and 7% for the 1990 recession. These probabilities quickly jumped higher over the ensuing months as the recession took hold.
The latest 2019 recession narrative does have some compelling components. The Fed started raising interest rates at the end of 2015 by 25 basis points. In 2016 there were three more hikes and in 2018 there were four, bringing the Fed funds rate from 0.25% to 2.50%. The recession narrative centers around the view that the Fed went too far – arguably as they do in every cycle – and now the data is slowing faster. This is why the yield curve has inverted.
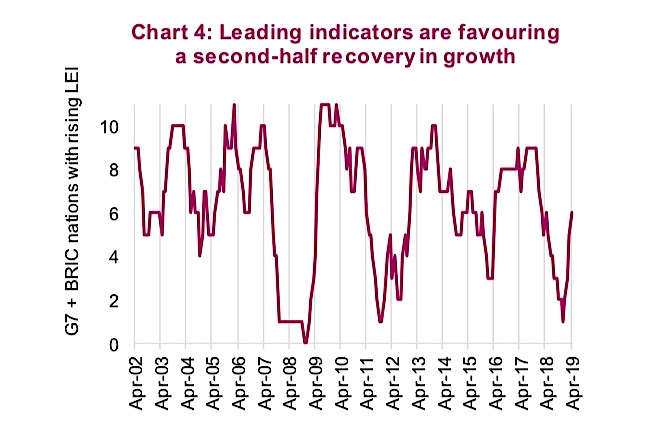
While certainly possible, a 2.5% Fed funds rate is not that high. Plus, the pullback in yields and lower credit spreads contribute to alleviating the pressure from marginally higher short-term rates. Given much of the above is based on the bond market, the corporate bond market is certainly not flashing any warning signs (chart 3 above). If a recession was imminent, shouldn’t credit spreads be much higher?
Second-half recovery in growth?
Of course, the best solution to this quandary would be some better economic data, which would quickly extend this market cycle. We started to see some more encouraging early signals that growth may be coming, but a few of these have withered over the past few months—perhaps just a reflection of the particularly cool spring weather this year (economists do love to blame the weather).
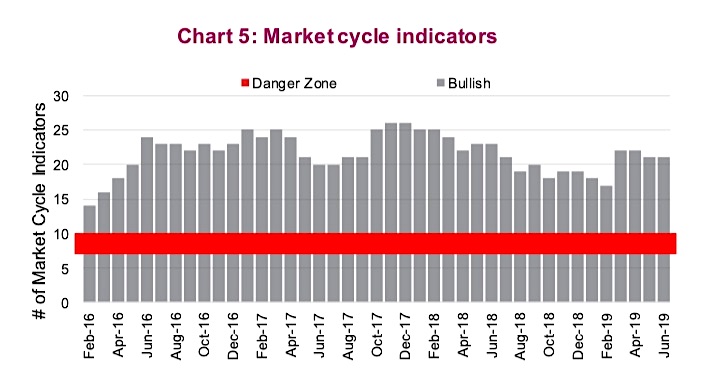
The most prominent reversal has been PMI manufacturing data. This has taken a hit due to the uncertainty surrounding tariffs. However, leading indicators remain encouraging. Chart 4 below tracks the relative three- month change in leading indicators for the G7 nations (the U.S., U.K., Germany, Japan, Canada, France and Italy), plus the BRIC nations (Brazil, Russia, India and China). These indicators have taken a strong turn to the upside in the past few months.
Also providing support that the current cycle’s end isn’t imminent are our
Market Cycle indicators. These not only cover yields, but economic data, commodities, sentiment, valuations and fundamentals. From our ‘human
learning’ development of this model, we have found that when one-third of the signals or more are bullish, the risk of a bear market is remote. Given we are at 21 positive indicators out of 30, this is certainly supportive of a continuation of the cycle.
The risks of a recession appear to have risen with softer data being reflected in the bond market; but at this point we do not see a recession developing in the coming quarters.
All charts are sourced to Bloomberg L.P. and Richardson GMP.
Twitter: @ConnectedWealth
Any opinions expressed herein are solely those of the authors, and do not in any way represent the views or opinions of any other person or entity.

 Flirting With Critical Support… Again")


