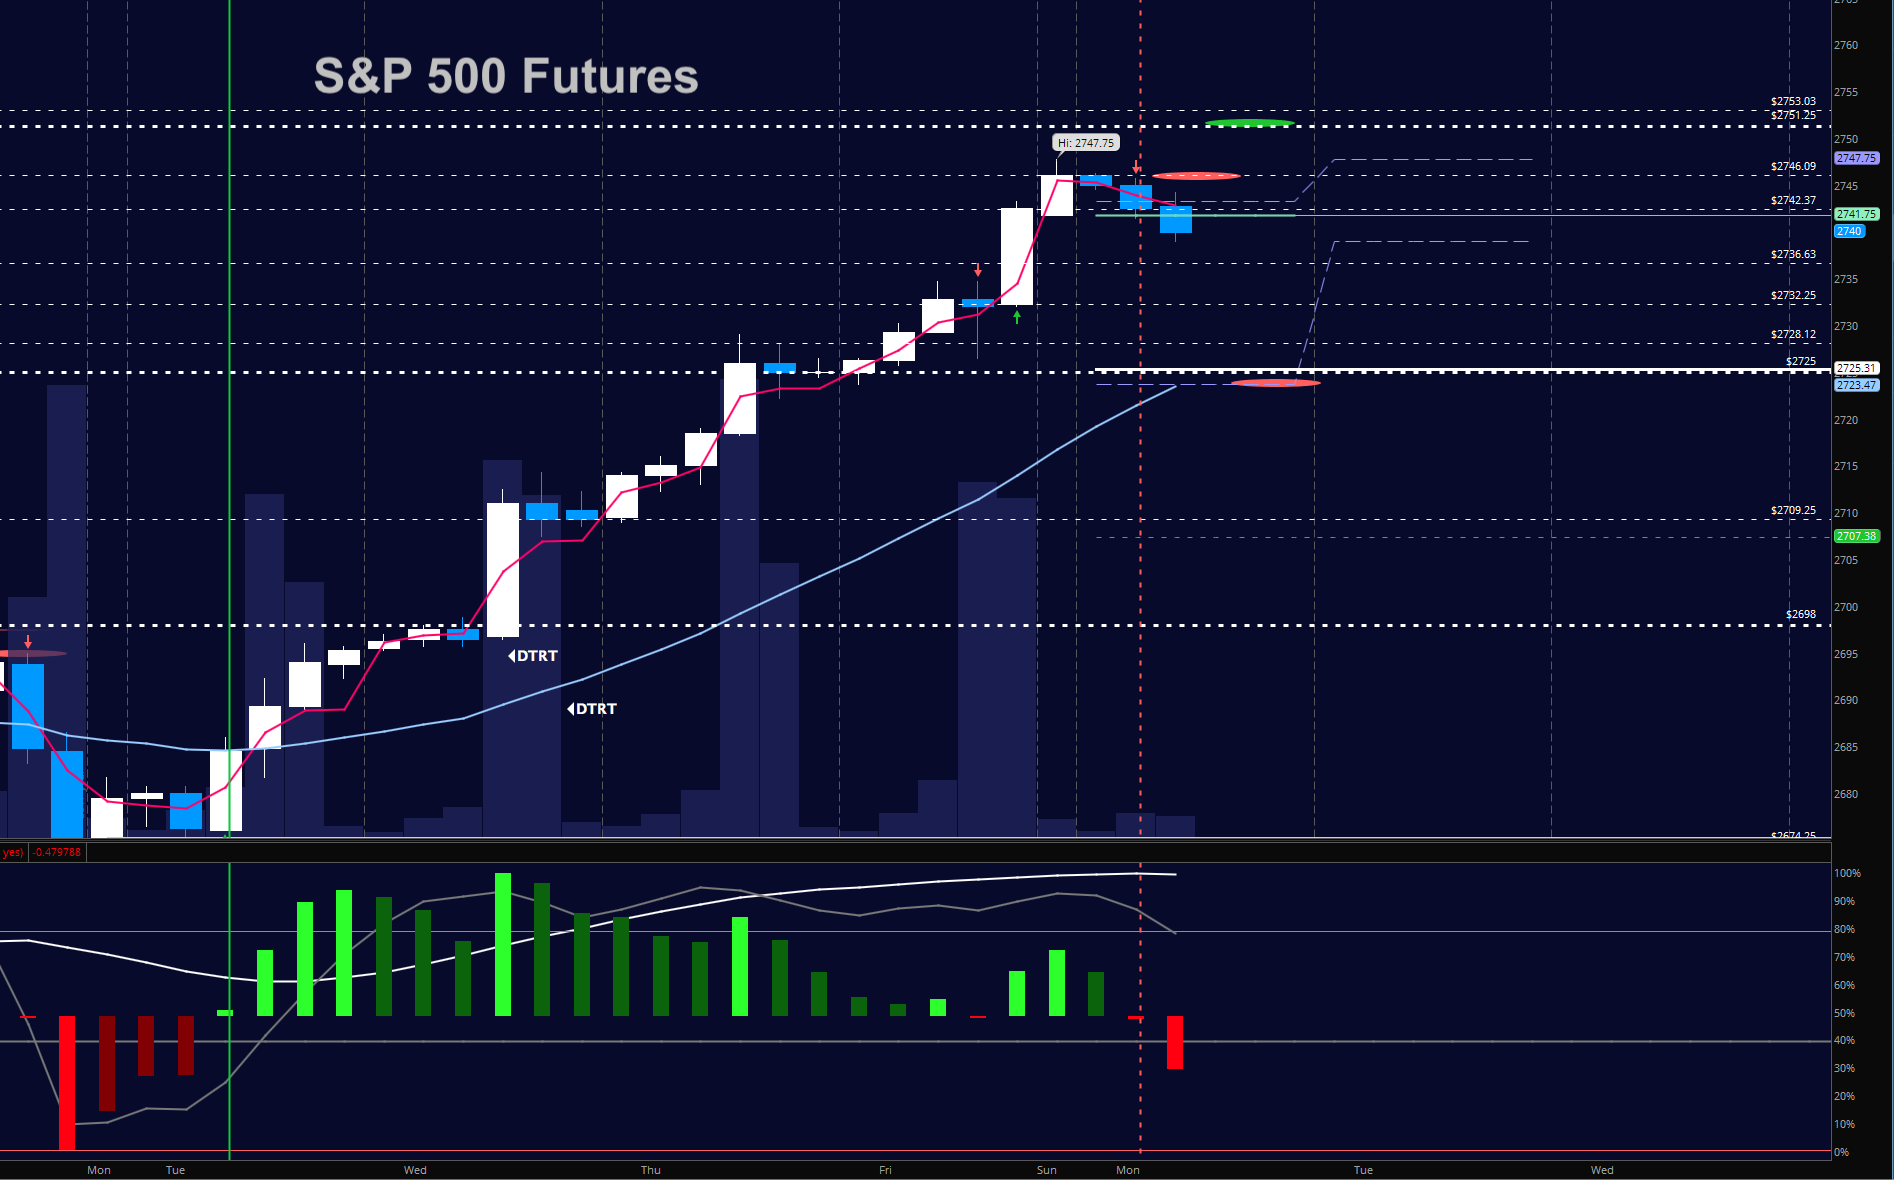
The broader stock market futures indices have stalled out at new highs made Sunday night. Stocks should find support at lower levels.
S&P 500 Trading Considerations For January 8, 2018
As mentioned, I suspect value buyers will come in to participate at less elevated prices once more, so I am looking for a fade to support near 2732 to see these buyers for the first time. If they do not have the power to bounce from there, we should see 2728-2725 next. Momentum holds strong on longer time frames. Patient value buying has proved to be the ideal game plan in the current space.
The bullets below represent the likely shift of trading momentum at the positive or failed retests at the levels noted.
- Buying pressure intraday will likely strengthen with a positive retest of 2746.5
- Selling pressure intraday will likely strengthen with a failed retest of 2736.5
- Resistance sits near 2746.5 to 2751.25, with 2753.5 and 2762.75 above that.
- Support holds between 2732.5 and 2722.5, with 2714.25 and 2709.25 below that.
S&P 500 Futures Chart w/ Key Trading Levels
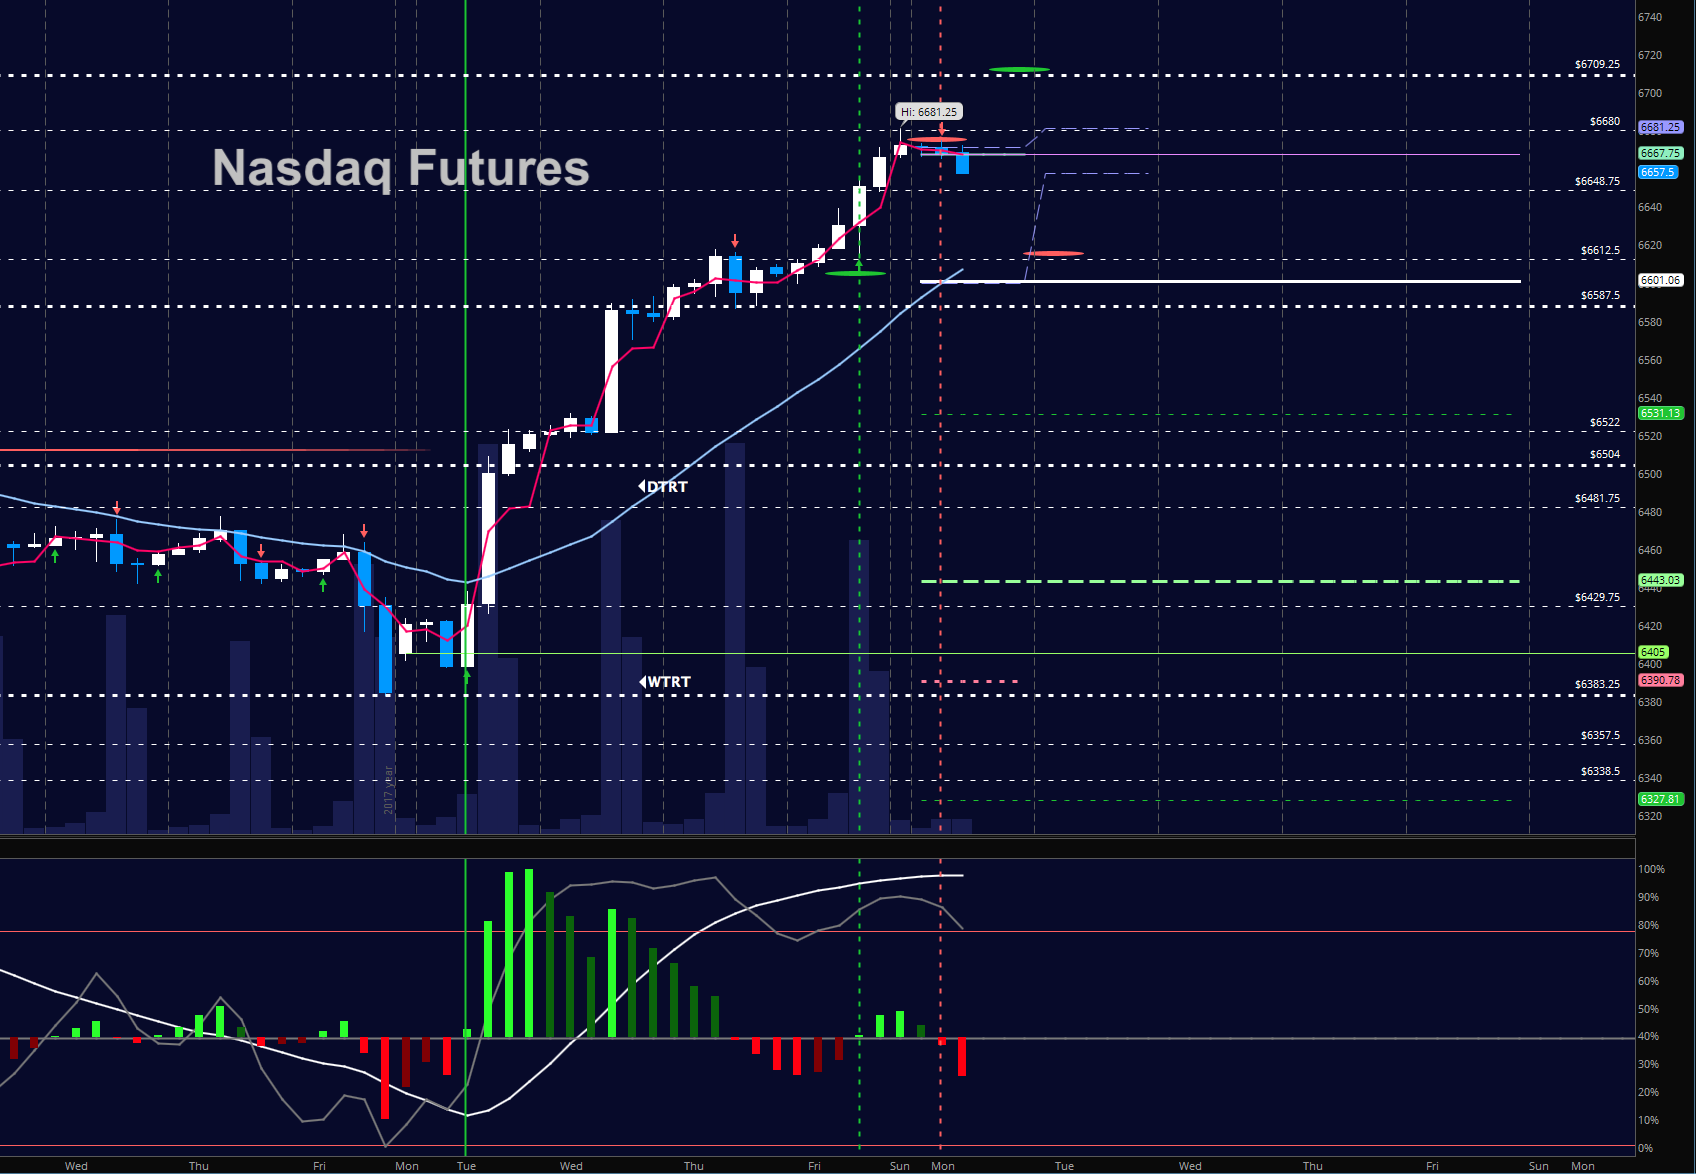
NASDAQ Futures
With a new high also presenting here on Sunday night, the NQ_F has started a small selling event that should open the floor to value buyers at the breakout level near 6612-6615. Buying pressure remains quite strong so a breakdown of any kind will need a failed retest of old support. The bullets below represent the likely shift of intraday trading momentum at the positive or failed tests at the levels noted.
- Buying pressure intraday will likely strengthen with a positive retest of 6680.75
- Selling pressure intraday will likely strengthen with a failed retest of 6648.75
- Resistance sits near 6671.5 to 6680.75 with 6709.25 and 6730.75 above that.
- Support holds near 6650.5 and 6629.75, with 6614.5 and 6598.5 below that.
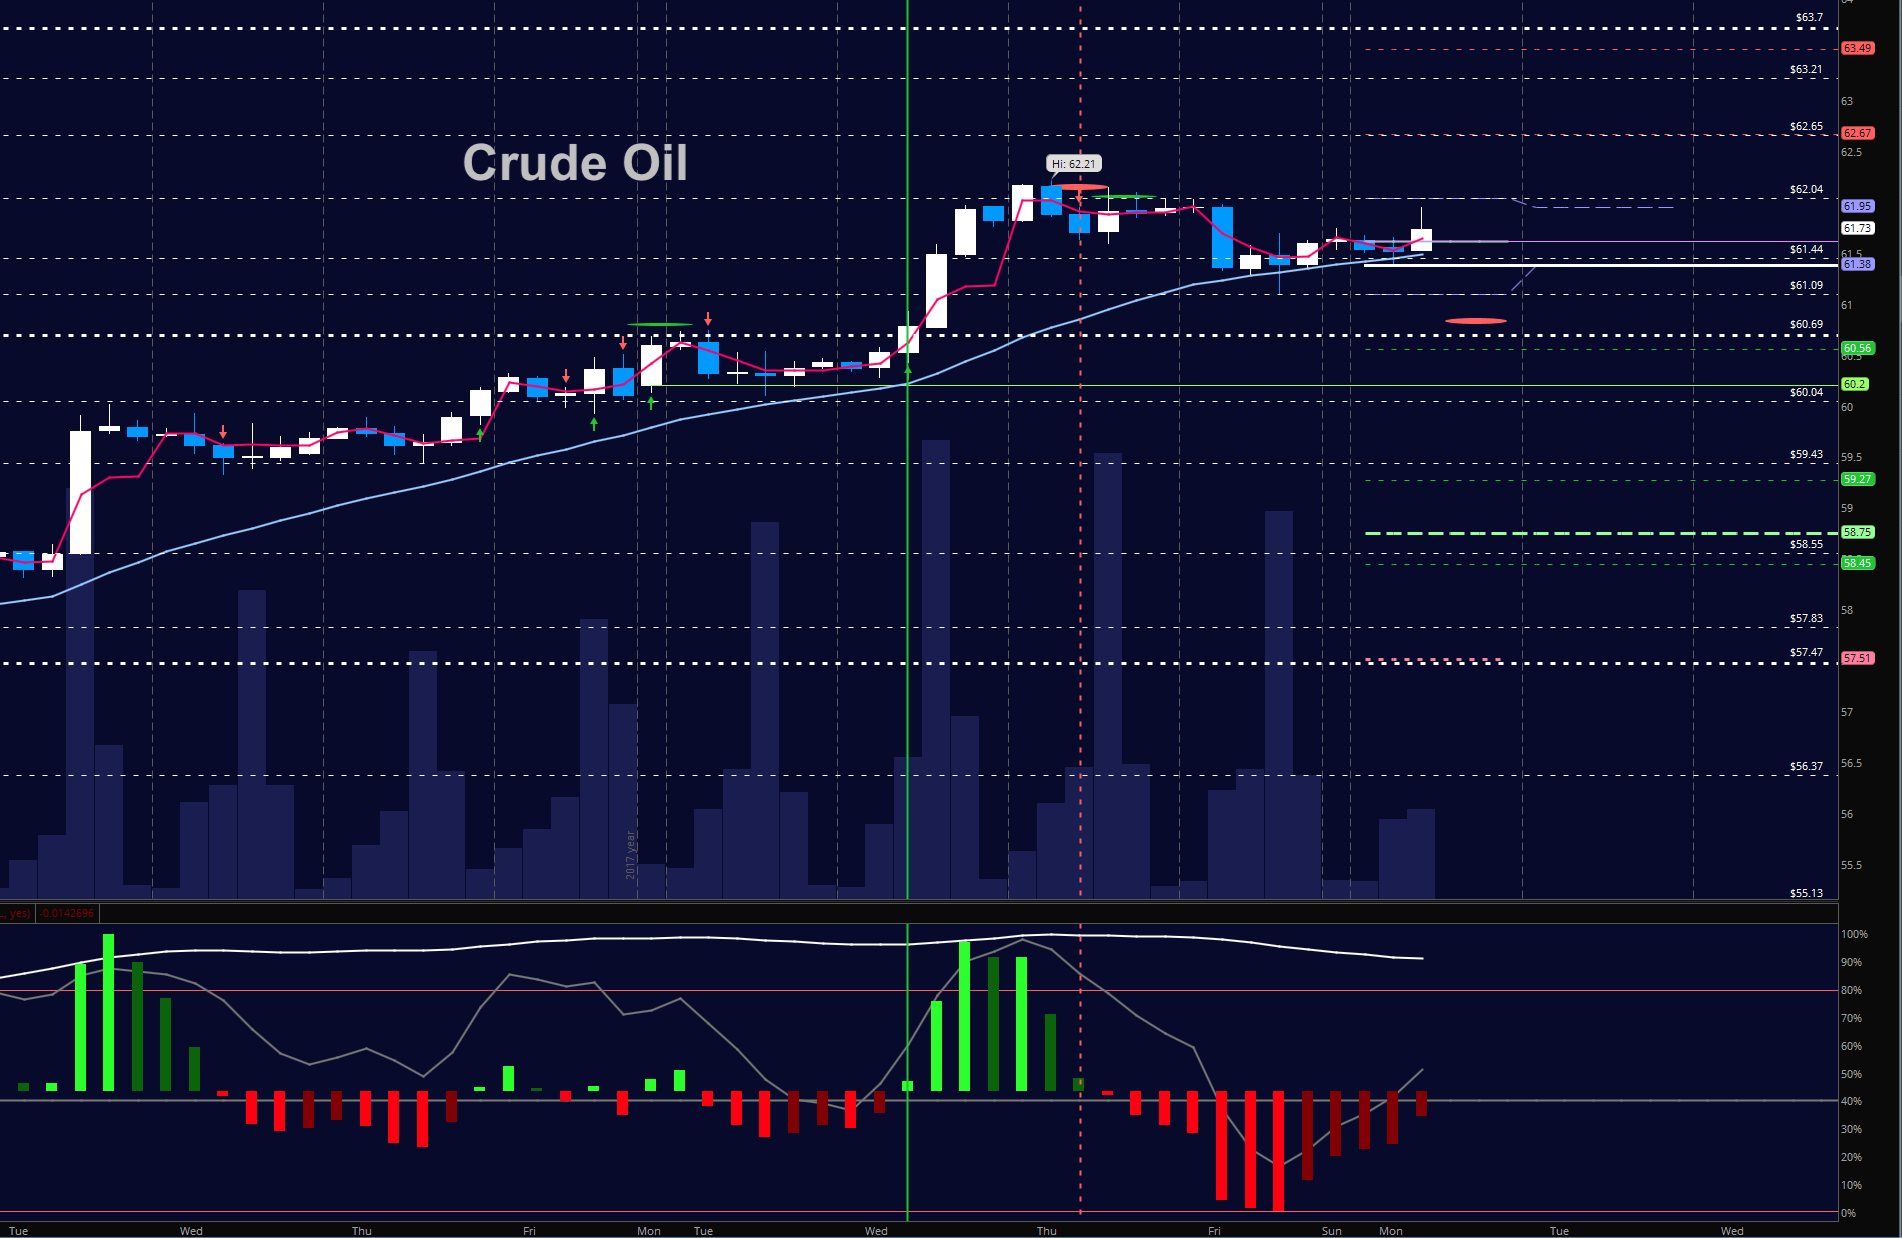
WTI Crude Oil
Traders continue to hold their bullish stance as the breach above 60 holds and expands into low auction regions beginning near 61.7 and 62.65 but with higher targets in mind near 63.7. The key level for buyers to hold today sits near 61.3. The bullets below represent the likely shift of trading momentum at the positive or failed tests at the levels noted.
- Buying pressure intraday will likely strengthen with a positive retest of 62.04
- Selling pressure intraday will strengthen with a failed retest of 61.09
- Resistance sits near 61.85 to 62.2, with 62.65 and 63.21 above that.
- Support holds near 61.32 to 61.09, with 60.77. and 60.24 below that.
If you’re interested in the live trading room, it is now primarily stock market futures content, though we do track heavily traded stocks and their likely daily trajectories as well – we begin at 9am with a morning report and likely chart movements along with trade setups for the day.
As long as the trader keeps himself aware of support and resistance levels, risk can be very adequately managed to play in either direction as bottom picking remains a behavior pattern that is developing with value buyers and speculative traders.
Twitter: @AnneMarieTrades
The author trades stock market futures every day and may have a position in mentioned securities at the time of publication. Any opinions expressed herein are solely those of the author, and do not in any way represent the views or opinions of any other person or entity.


