It’s time for another round of macro technical charts as investors attempt to weigh the risk to reward ratio in several markets (including stock market indices, sectors, individual commodities, currencies, bonds, and other benchmarks and market indicators).
This chart review will look at 5 charts with key technical price developments. Even if you’re not technical analysis minded, I believe that it’s a useful way to stay on top of global market trends across several major financial markets. You can also use this chart analysis as a prompt for further analysis and investigation…
In this edition we look at Crude Oil seasonality, European equities via the Euro STOXX 50, the Emerging Markets ETF (NYSEARCA:EEM), Japanese Government Bonds, and Base Metals (NYSEARCA:DBB).
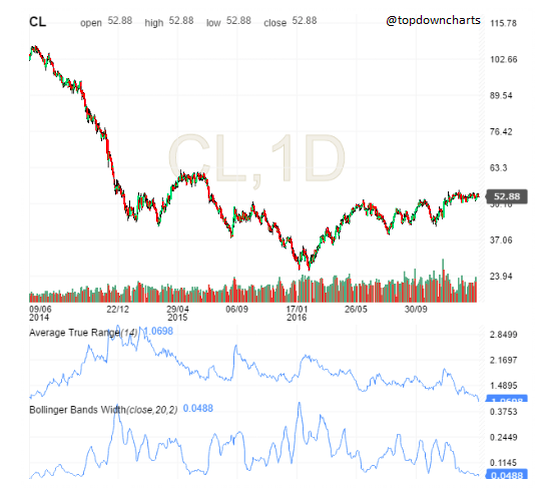
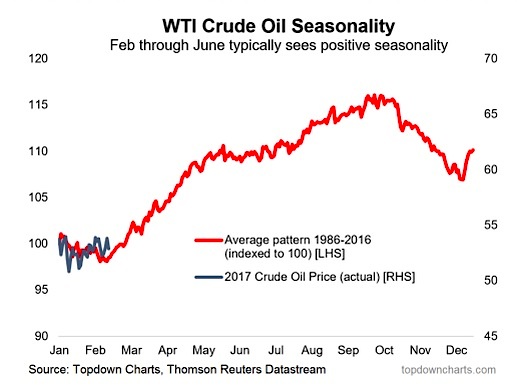
1. Crude Oil – Seasonal Bias
The volatility compression continues in crude oil as the price coils up within the unusually tight range, as noted in the commodities special edition of the Weekly Macro Themes.
The Average true range and bollinger bandwidth have tightened up to extreme lows, which to me suggests a high chance of a near term breakout, and likely an explosive one at that. Seasonality is starting to turn positive, which will bias the breakout expectations to the upside.
Overall technical view: Bullish bias on seasonality, but wait for the breakout.
NEXT CHART (Euro STOXX 50)…


