Today I want to share 5 macro technical charts that bear importance here for the broader markets. In my chart review, I sift through individual commodities, currencies, bonds, and sectors, as well as the rest of the major indexes and benchmarks.
This chart review strictly looks at technical price developments. Even if you’re not technical analysis minded it’s a useful way to keep on top of global market trends in some of the main financial markets. You can also use this as a prompt for further investigation…
Today we look at Crude Oil, the Aussie, the Dollar, and equities markets for Brazil and the Philippines.
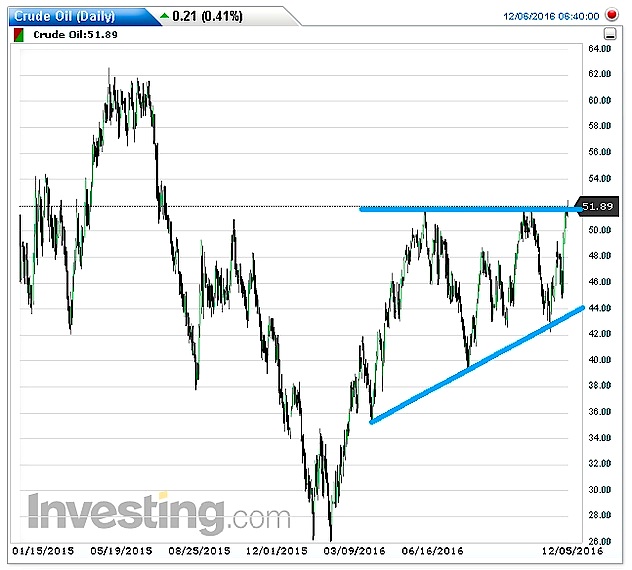
- Crude Oil – Ascending Triangle
Crude oil has broken above the psychologically important $50 point, and the more important resistance level of $51 a barrel.
This also marks an upside breakout from an ascending triangle; typically a bullish continuation pattern which represents a period of accumulation.
The simple measure rule for an ascending triangle is to take the widest part of the triangle and add it to the resistance line which in this case would suggest a price target of $66 (51-36 + 51).
Overall technical view: Bullish (but on watch for any signs of a failed breakout)
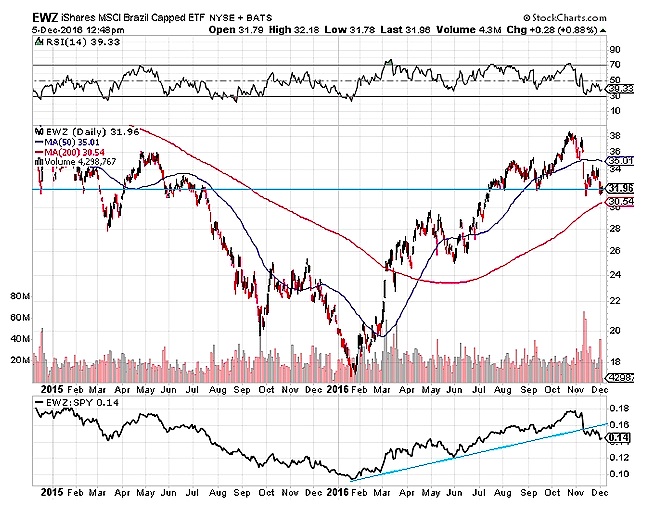
- Brazilian Equities – Make or Break
Key Brazilian equity ETF currently sitting on support, and remains above its 200 day moving average (keep these levels in mind for downside risk control on the long side).
Seeing minor bullish divergence against the RSI; which also by the way went oversold and has turned up.
However on a relative to SPY (US equities) basis it’s broken the up trend line. So it makes for a very mixed picture; a make or break moment where if support and the 200dma goes it will be the start of a big down move. Yet there are positive signs, so a break back above the 50dma would be bullish (and a risk control point for shorts).
Overall technical view: Neutral – on watch for a possible downside breakout
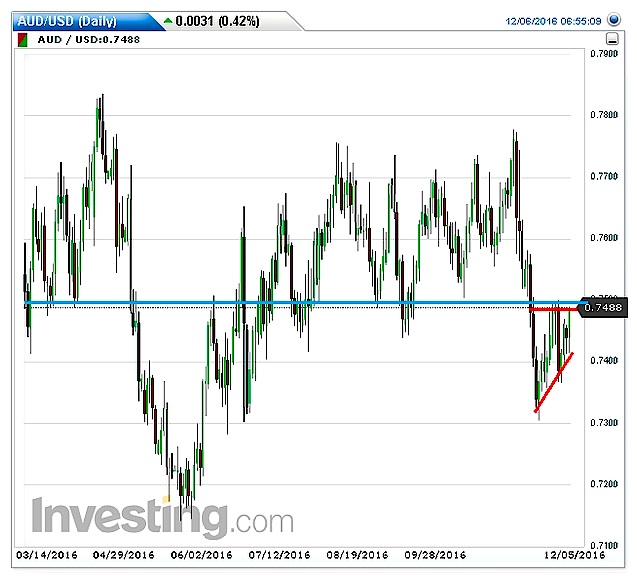
- AUDUSD – Bear Flag
AUDUSD broke below support of 0.75, but price has come back towards previous support (now resistance).
However price action since then has set up what looks like a bear flag (small triangular pattern with price trend leaning against the direction of the initial move).
Typical measure rule for a bear flag (which is a continuation pattern) is that the flag is positioned halfway through the move, so you measure the length of the “flag pole” and add it to the breakout; assuming it broke down from 0.74 this would imply a potential 400bp move (0.7750-0.7350) which would take it down towards 0.70
Overall technical view: Bearish bias given the bear flag, but a break down still needs to be seen
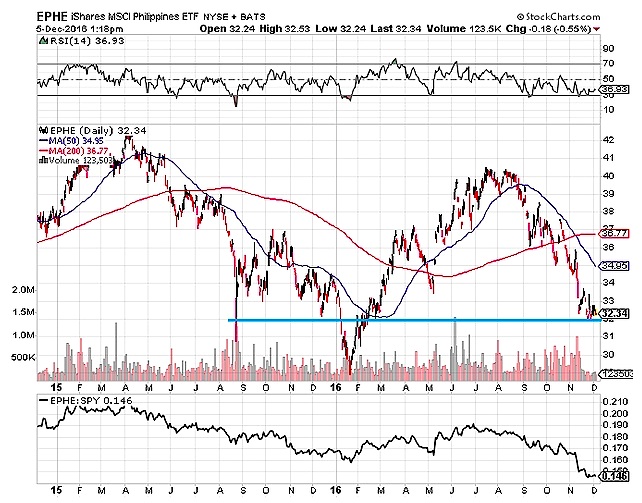
- Philippines – Support and exhaustion
After breaking down following the solid rebound since the lows in January, Philippine equities are resting on support and the downside move is starting to look exhausted.
RSI is tentatively starting to track upwards, price is consolidating around support of $32, and the relative to US equities performance line appears to have bottomed.
An upside break through $33 (which was support in late 2015) would be a bullish trigger.
Overall technical view: Bullish bias, look for a break
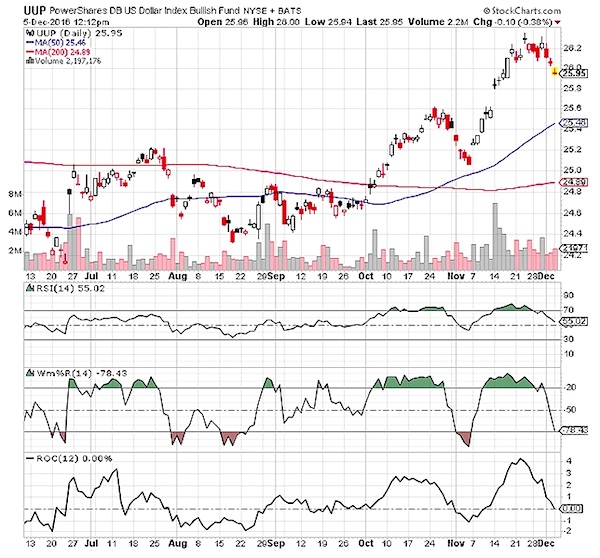
- US dollar – Becoming oversold
US dollar starting to look oversold (RSI, Williams R%, ROC).
Bar is generally lower for oversold signals in a strong uptrend.
Optimal course of action is to wait for a stronger oversold signal, or to wait until you get the classic signal of the oscillator, e.g. RSI, going oversold and then turning up.
Overall technical view: Bullish, looking for opportunities to buy the dip.
Thanks for reading. Get more analysis and insights from Callum’s blog Top Down Charts.
Twitter: @Callum_Thomas
Any opinions expressed herein are solely those of the author, and do not in any way represent the views or opinions of any other person or entity.


 Nears Important Pivot Point")
 Vying For Stock Market Leadership Role")


 Nears Important Pivot Point")