Over the past several months, I’ve been surprised to see oil prices remain stagnant in the face of geopolitical events.
Ukraine/Russia, Israel/Iran. Crude oil has recently traded between $55 to $65.
That said, oil appears to be basing and attempting to move higher.
Today, we look at a chart of the United States Oil Fund ETF (USO) and highlight its recent breakout attempt.
Note that the following MarketSurge charts are built with Investors Business Daily’s product suite.
I am an Investors Business Daily (IBD) partner and promote the use of their products. The entire platform offers a good mix of tools, education, and technical and fundamental data.
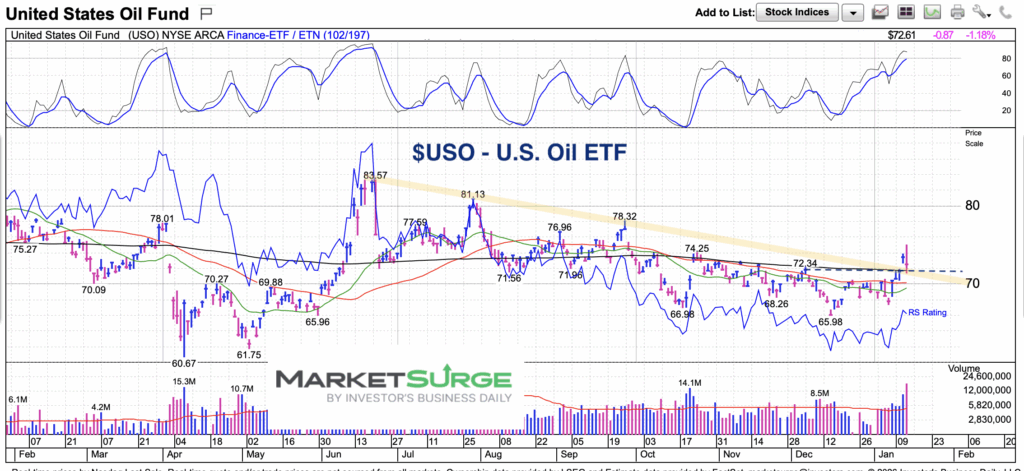
$USO United States Oil Fund ETF Chart
Here we can see USO breaking out above its down-trend line. If this sticks, it would likely indicate the start of a rally.
Twitter: @andrewnyquist
The author may have a position in mentioned securities at the time of publication. Any opinions expressed herein are solely those of the author, and do not in any way represent the views or opinions of any other person or entity.


