I’m back with another set of 5 macro technical charts to watch as we move further into the near year (including stock market indices, sectors, individual commodities, currencies, bonds, and other benchmarks and market indicators).
This chart review will look at technical price developments. And even if you’re not technical analysis minded I believe that it’s a useful way to keep on top of global market trends across the main financial markets. You can also use this chart analysis as a prompt for further analysis and investigation…
Today we look at charts of US Treasury bonds (TNX), Japanese 10 Year Bonds (JGBs), Crude Oil (NYSEARCA:USO), the Mexico ETF (NYSEARCA:EWW), and Gold (NYSEARCA:GLD).
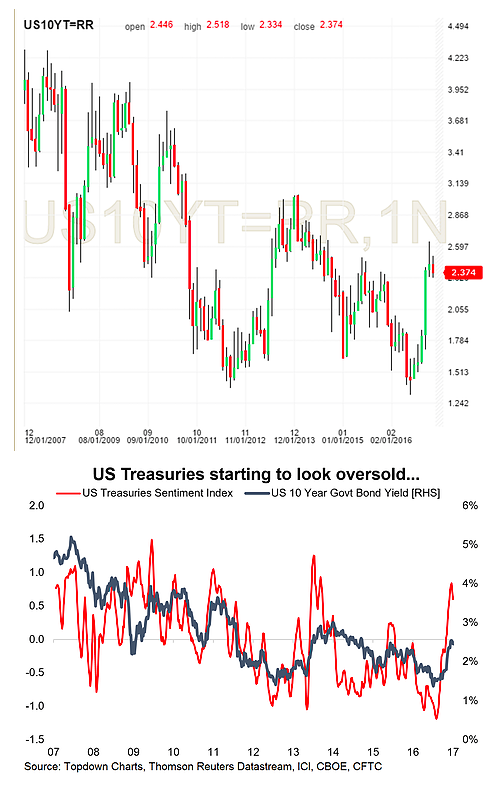
1. US Treasuries – Oversold
US treasuries look oversold with the composite sentiment index (includes positioning, flows, implied volatility, and breadth) hitting extreme pessimistic levels and then turning.
Looking at the chart of the yield it stopped right at resistance of around 2.50%, time will tell if this resistance point becomes support (after a new breakout).
Expect a period of consolidation before any retest higher: 2.60% is an important trigger point.
Overall technical view: Neutral, expect a period of consolidation; wait for a breakout.
Next chart (JGBs chart)…


