Here’s the regular 5 macro technical charts (going as far as individual commodities, currencies, bonds, and sectors, as well as the rest of the major indexes and benchmarks). This commentary is strictly focused on the technical/price developments (albeit we will typically cover the broader case in the Weekly Macro Themes where the technical and fundamental set up produce a compelling investment idea).
This chart review strictly looks at technical price developments. Even if you’re not technical analysis minded it’s a useful way to keep on top of global market trends in some of the main financial markets. You can also use this as a prompt for further investigation…
Today we look at Global equities, the S&P 500 (INDEXSP:.INX), Gold Prices (NYSEARCA:GLD), Copper Futures, and the Japanese 10 Year Bond (JGB).
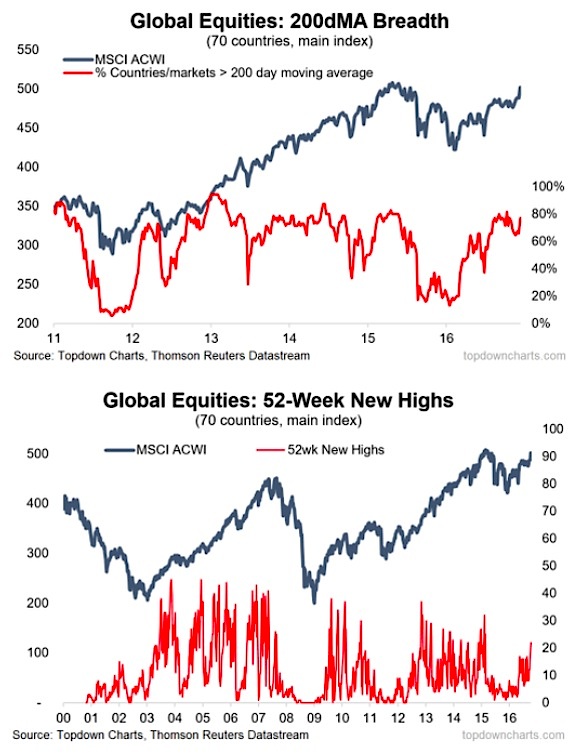
1. Global Equities – Breadth Thrust
-Global equities (MSCI ACWI/All Countries World Index – in local currency terms) has broken back above the 500 mark, and is just over 1% away from the previous all time high (as of Friday).
-Looking at 200-day moving average breadth (at the country level; across the main benchmark of 70 countries) a similar pattern is occurring to that which took place in early 2013 (thrust in breadth, and breakout).
-The 52-week new highs confirm this, with a spike
Overall technical view: Bullish, expect all time new highs
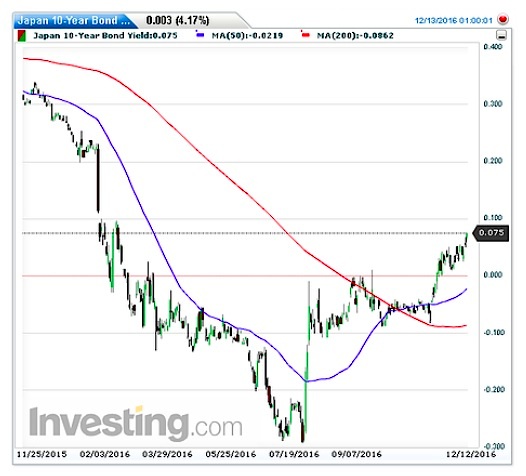
2. JGB – Island reversal for the widow maker?
-November saw the Japanese 10-year government bond yield make a clear upside breakout, with the yield now back into positive territory after a period of negative yields.
-Visible on the daily and more clearly on the weekly it looks like the 1-Feb gap might be set to get closed; a closing of that gap would create an enormous island reversal and herald a trend change.
-Aside from the gap, the critical level is 0.10% and that will be the main test.
Overall technical view: Bullish (on yield, i.e. bearish on the bond price)
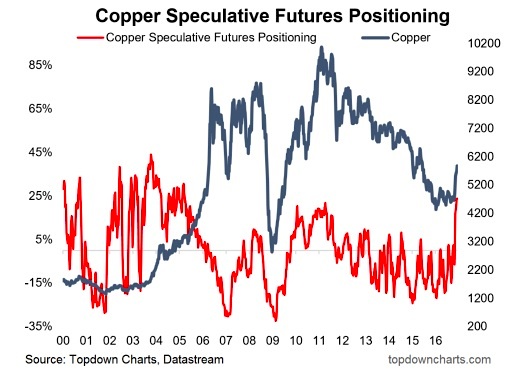
3. Copper Futures – Speculative positioning
-As previously noted, copper looks to be in the process of starting a new bull market.
-Speculative futures positioning has reached an 11 year high for copper, and has done so at a rapid pace and at this point is certainly looking stretched.
-Such a surge in speculative positioning is consistent with a trend change, e.g. during the early 2000’s.
Overall technical view: Bullish, risk of a short-term pullback, but futures positioning shows strong momentum.
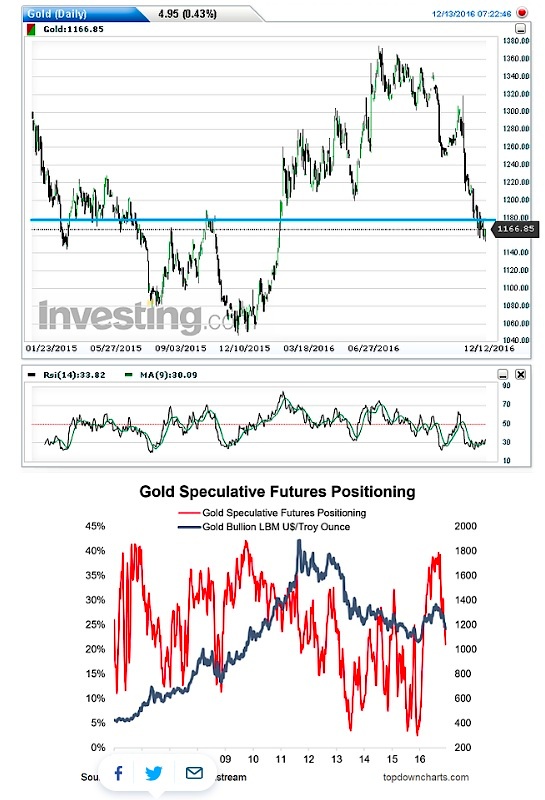
4. Gold – Another support line broken
-Gold is barging its way through multiple lines of support.
-Speculative futures positioning has pulled back significantly (but for the bears – it’s only at the middle of the range, and thus there is ample scope for downside from here).
-RSI has bottomed out at oversold levels (30 point mark) and is tentatively trending up; ripe conditions for a rebound.
Overall technical view: Bearish overall, but increasing risk of a short-term bounce
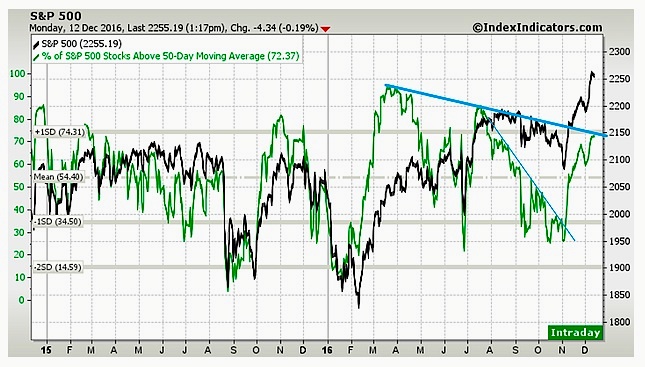
5. S&P 500 – Another line in the sand for market breadth
-As mentioned in the latest S&P 500 ChartStorm another line in the sand is being approached on the 50-day moving average breadth chart.
-The previous downtrend line in market breadth (the logical conclusion of which would have been a deeper correction) was broken with explosive upside results.
-The latest downtrend line in market breadth (the bolder line in the chart) will be a key test, and if the test is passed it could mean equally strong price action, but it will also bring the market into a more euphoric and overbought phase — if the test is failed it means a short-term correction.
Overall technical view: Bullish bias, but watch that line in the sand – it’s a key test for the market.
Get more analysis and insights from my blog Top Down Charts. Thanks for reading.
Twitter: @Callum_Thomas
Any opinions expressed herein are solely those of the author, and do not in any way represent the views or opinions of any other person or entity.


: Showing Some Signs of Emerging Strength")
