 These 3 bear market signals are typically present near major stock market tops:
- Waning momentum
- Bad breadth
- Defensive credit markets
Central Banks Are Part Of Markets
Before we examine the bear market signals and red flags that were waving in 2000 and 2007 and how they relate to 2013, it is important to acknowledge the role of central banks in the stock market’s advance
QE Is A Well-Defined Process
When we say markets are manipulated, we do not mean in an Area 51/government conspiracy manner. Any government intervention into any market distorts asset prices. For example, a tax credit for new home buyers impacts (distorts/manipulates) the price of housing. From an investment perspective, we must respect what QE is, understand how it works, and incorporate its impact into our assessment of the markets. Central banks have been manipulating markets well before most of us were born, and they will be manipulating markets after we are all dead. We do not have to like the Fed’s role, QE, or any form of market intervention, but to be successful we must respect their undeniable impact on asset prices.
1. Momentum Speaks To Economic Conviction – Bear Market Signals
The market’s pricing mechanism, based on the aggregate opinion of every investor around the globe, allows us to compare economic confidence in late 2000 to the present day. If you prefer, a more direct way to say it is charts enable us to monitor the conviction that stocks will push higher relative to the conviction that stocks will fall. The aggregate investor opinion is based on the aggregate interpretation of the economy, earnings, Fed policy, etc. The previous sentence helps us understand the concept that the fundamentals are reflected in the charts.
Momentum indicators, like the widely used MACD, can be thought of as conviction indicators. When momentum is strong, conviction about positive economic outcomes is strong. Conversely, weakening momentum speaks to weakening bullish conviction about earnings, geopolitical events, monetary policy, and the global growth story. This is why it is one of the bear market signals. The monthly chart of the S&P 500 below shows momentum was waning as stocks pushed higher between mid-1999 and mid-2000. Weakening momentum (see thick red line) foreshadowed the 50%-plus decline in the S&P 500 (dot-com bust).
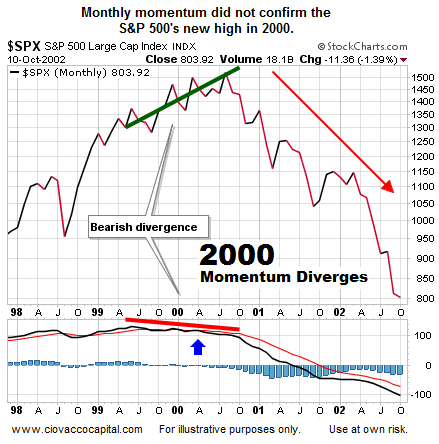
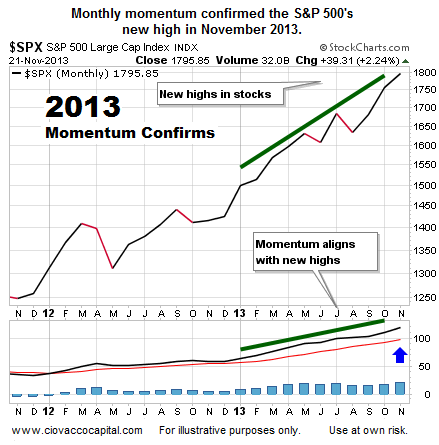
How does the same chart look today? The answer is much better. Instead of a bearish “non-confirmation”, present day momentum is rising with price, which speaks to ongoing confidence about future economic outcomes, earnings, and Fed policy.
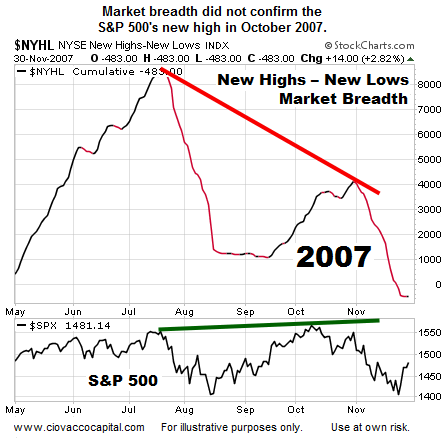
2. Bad Breadth Can Foreshadow Bear Markets – Bear Market Signals
Market breadth speaks to the number of stocks participating in an advance. Strong market breadth means a high percentage of stocks are making new highs as the major indexes make new highs. Strong breadth also aligns with widespread confidence in stocks and the economy. The chart below tracks the number of NYSE stocks making new highs minus the number making new lows. A bearish divergence was clearly evident three months before the bull market peaked in October 2007.
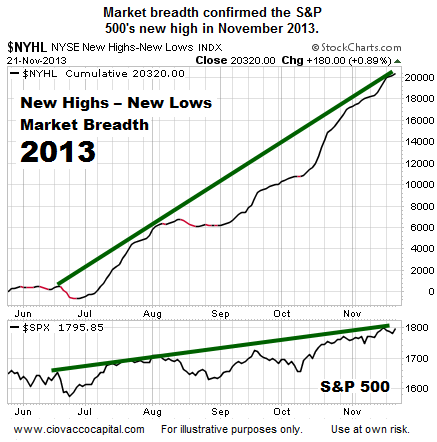
How does the same chart look today? The answer is much better. Instead of a bearish “non-confirmation”, present day market breadth is rising with price, which speaks to ongoing confidence about future economic outcomes, earnings, and Fed policy.
3. Credit Markets Often See Problems First – Bear Market Signals
Our market model uses numerous risk-on vs. risk-off ratios to monitor investors’ tolerance for risk. The bond market (a.k.a. credit market) tends to focus on two major issues:
- How much does this bond pay?
- What are the odds of default?
When the market determines bond default probabilities, it includes an assessment of the economy. If the odds of a recession are low, then the odds of widespread bond defaults are also low. Conversely, if the odds of a recession are high, the odds of bond defaults also begin to increase. If you believe the odds of widespread bond defaults are low, then you would prefer to own a bond that pays a higher yield. If you believe the odds of bond defaults are rising, then you would prefer to own a higher rated and more conservative bond.
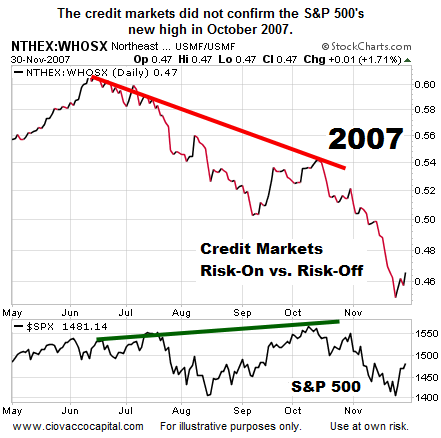
Risk-On vs. Risk-Off
We can monitor the battle between yield and defaults by tracking the performance of higher yielding junk bonds (JNK) relative to more conservative Treasuries (TLT). Since JNK was not around in 2007, the chart below uses mutual funds as proxies for JNK and TLT. What was the bond market saying about the economy and default risks in late 2007? The aggregate opinion of bond market investors was pointing to bearish outcomes for both the economy and financial markets. The slope of the red line below reflects waning demand for more aggressive junk bonds relative to more conservative Treasuries.
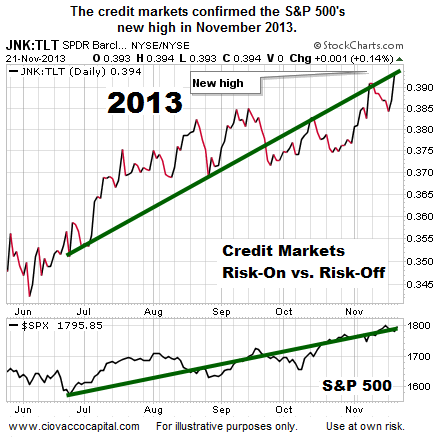
How does the same chart look today? The answer is much better. Instead of a bearish “non-confirmation”, the demand for more economically-sensitive junk bonds continues to be greater than the demand for defensive Treasuries, which speaks to ongoing confidence about future economic outcomes, and more importantly for bond holders, a reasonable expectation that they will receive their interest and principle payments.
2014: QE Coming To Europe?
Bad economic news often translates into more market-friendly monetary policy from central bankers. Rumblings of Europe hopping on the quantitative easing (QE) train have been growing in recent weeks. From Reuters:
The European Central Bank’s chief economist said on Friday the euro zone faces deflationary pressures, and the bank’s president stressed that interest rates must remain low “because the economy is weak”. With euro zone inflation running at 0.7 percent, well below its target of just under 2 percent, a raft of ECB speakers this week have said it is open to taking fresh measures to support the economy. Vice-President Vitor Constancio said on Tuesday “everything is possible” and both he and economics chief Peter Praet have said asset buying – or quantitative easing (QE) – is an option after years in which the bank’s policymakers have ruled it out.
Gloom And Doom At Odds With Evidence
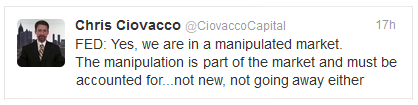
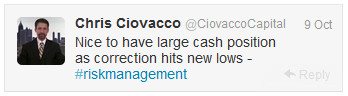
As we outlined using hard evidence on November 12, despite all the calls for a major market top and never-ending use of the term bubble, the facts do not support the “euphoria and everyone is in the stock market” theory. A fair question to those who believe a major top is just around the corner, why do the 2013 charts above align with the bullish case? Another objection to the analysis above might be “these guys are permabulls”. As the dated tweet from October 9 shows, we were concerned/bearish/defensive until the observable evidence improved on October 10, when our market model began calling for redeployment of our cash. For the record, the current stock market rally began on October 10, after an intraday reversal on October 9.
Investment Implications
The message from the market’s pricing mechanism in 2013 is much more favorable for stocks than 2000 or 2007. Since thinking in probabilities and flexibility are 2 of the 4 keys to portfolio management, we must understand how to use the charts above. If economic data, Fed policy, and/or weak earnings result in a shift in the aggregate tolerance for risk, we must adjust our exposure to stocks in an appropriate manner. As long as the message is one of “risk-on”, we will continue to hold our positions that were established between October 9 and October 18, including broad U.S. exposure (VTI), technology (QQQ), financials (XLF), energy (XLE), foreign stocks (EFA), and emerging markets (EEM).
Note that this article was published as a Short Take on Ciovacco Capital’s Blog.
Follow CCM on Twitter: @CiovaccoCapital.
Any opinions expressed herein are solely those of the author, and do not in any way represent the views or opinions of any other person or entity.


