The following is a recap of the August 4 Commitment of Traders Report (COT) released by the CFTC (Commodity Futures Trading Commission) looking at Commitment of Traders data and futures positions of non-commercial holdings as of August 1.
Note that the change in COT report data is week-over-week. Excerpts of this blog post also appear on Paban’s blog.
3 Commitment of Traders Report Charts Looking At Spec Futures Positions in Crude Oil, Gold and the US Dollar.
CRUDE OIL
Currently net long 498k, up 53.8k
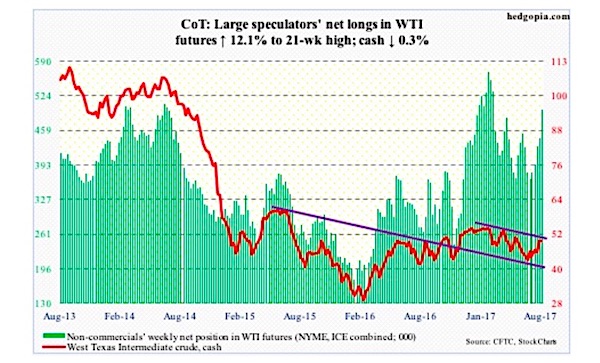
The trend-line resistance from February this year is proving a bit too much to conquer.
After rallying 20 percent from June 21 low, spot West Texas Intermediate crude oil ($49.58/barrel) was rejected at that resistance. Tuesday, it rallied to $50.43, before coming under slight pressure.
As things stand, with the daily chart overbought, bulls and bears are fighting a tug of war at the 200-day moving average. The 50-day moving average lies at $46.46. Plus, there is price support at $47.
From the inventory perspective, Wednesday’s EIA report was not that bad, but other elements were mixed.
For the week ended July 28, crude stocks fell 1.5 million barrels to 481.9 million barrels. From the all-time high 535.5 million barrels in the March 31st week this year, oil stocks are now down 53.7 million barrels, although they are still higher than the five-year average of 409.6 million barrels.
Gasoline stocks dropped 2.5 million barrels to 227.7 million barrels – a 31-week low. Distillate stocks decreased 150,000 barrels to 149.4 million barrels – a nine-week low.
Capacity utilization rose 1.1 percentage points to 95.4 percent. This was the highest since August 2015.
On the other hand, crude oil imports increased 209,000 barrels per day to 8.25 million b/d – an eight-week high.
Crude production rose 20,000 b/d to 9.43 mb/d. This was a two-year high. Since OPEC reached an agreement to cut back production by 1.8 mb/d last November, U.S. production has gone up by 731,000 b/d.
GOLD FUTURES
Currently net long 129.7k, up 38.8k
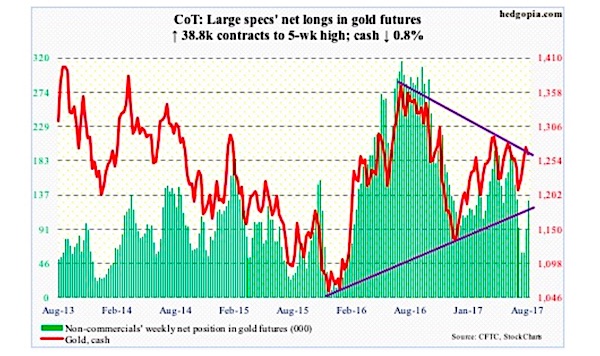
Last week, Gold spot prices ($1,264.6/ounce) feebly broke out of a falling trend line from July last year, but struggled to build on it this week. It did rally to $1,280.3 on Tuesday. Price resistance at $1,300 was not tested.
The SPDR Gold ETF (NYSEARCA:GLD) continues to struggle to attract funds. In the week to Wednesday, it lost $142 million, with last Thursday the only session the ETF saw activity. In the last seven weeks, $2.5 billion has been withdrawn (courtesy of ETF.com).
The daily chart for Gold (GLD) is extended. In the event the metal comes under pressure, the 50-day lies at $1,253.64.
US DOLLAR INDEX
Currently net short 1.6k, down 938
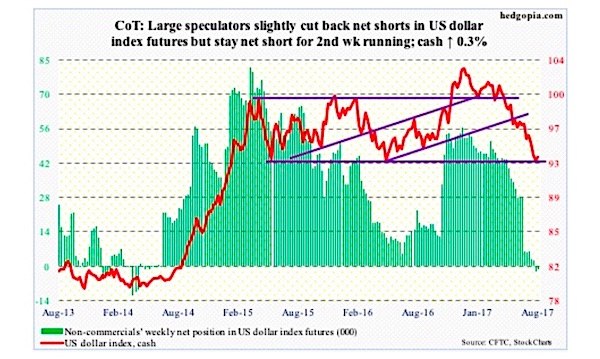
Prior to Friday’s 0.8-percent rally, the US Dollar spot index (93.42), under relentless pressure this year, was unable to catch a break.
However, Wednesday’s intraday low of 92.39 tested another crucial support – 92-plus goes back to at least 1998.
Odds of a rally have grown, but resistance is galore for the US Dollar – 93.95, 95.30 and 96.50. The 50-day lies at 95.64.
Thanks for reading.
Twitter: @hedgopia
Author may hold a position in mentioned securities at the time of publication. Any opinions expressed herein are solely those of the author, and do not in any way represent the views or opinions of any other person or entity.


