The final trading day of May is seeing waving US Futures markets and flattish European and Asian markets.
The US Equities market is set to finish positive for the month… which would mark gains in the S&P 500 (INDEXSP:.INX) 6 out of the last 7 months since the election (with March missing just by a hair).
Around the markets:
The US Dollar Index (CURRENCY:USD) is lower, touching multi-day lows before bouncing. Meanwhile, Crude Oil is trading lower and Treasury yields are attempting to stabilize (and trying to work higher). The Bloomberg world index is at multi-day highs today after 3 down days and globally, stock market indices look likely to start a push higher. The S&P 500 is capable of a move up near 2435. And bulls will be emboldened on a move above 2417.
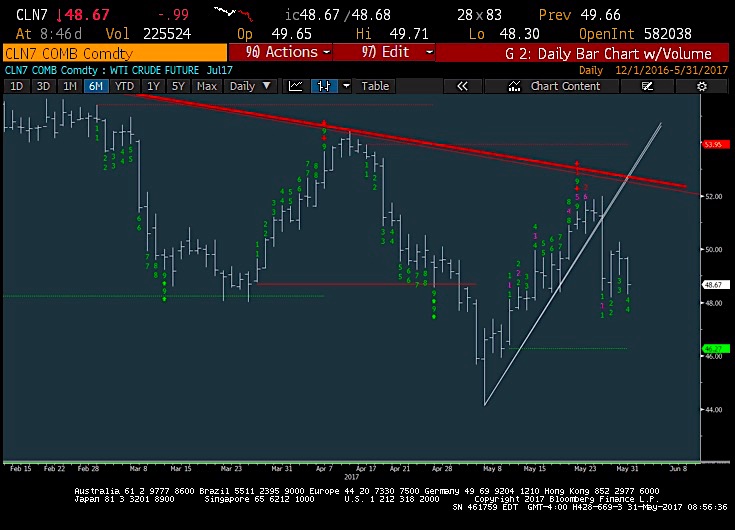
1. Crude Oil
Crude Oil’s move was quite negative this morning, down another 2.5%. Price support remains at 46.25. My thoughts: avoid and/or short OIH, XLE, XOP.
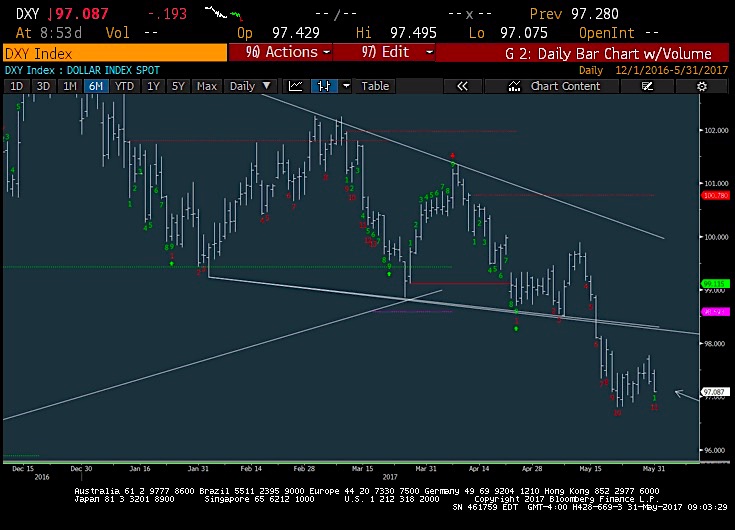
2. US Dollar Index
The US Dollar index is weakening as well. DXY hit multi-day lows and a move down to new monthly lows is likely here as well. The EURUSD should reach 1.13.
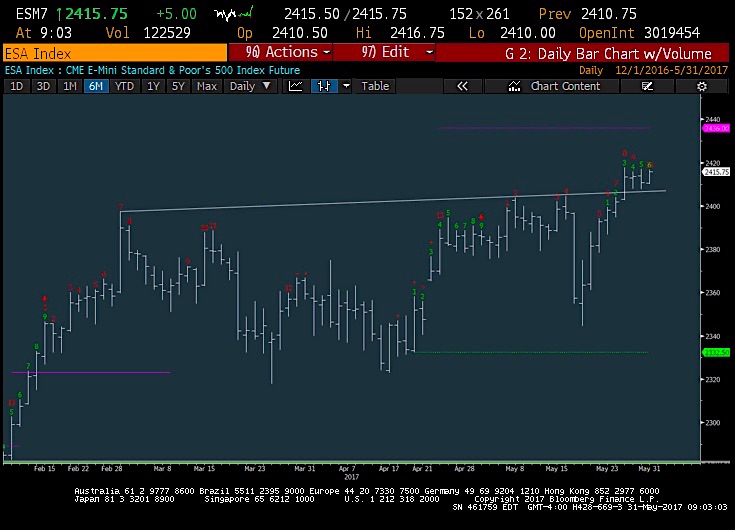
3. S&P 500 Futures
Stabilization and a move to new all-time closing highs should result in a push higher as the market largely ignores the policy dynamics. ABOVE 2417 is important and will lead to a push up to 2425/2435 in June futures.
If you are an institutional investor and have an interest in seeing timely intra-day market updates on my private twitter feed, please follow @NewtonAdvisors. Also, feel free to send me an email at info@newtonadvisor.com regarding how my Technical work can add alpha to your portfolio management process. Thanks for reading.
Twitter: @MarkNewtonCMT
Any opinions expressed herein are solely those of the author, and do not in any way represent the views or opinions of any other person or entity.
: Creating Bullish Divergence?")


 and Semiconductors (SMH): Concerning Price Pattern?")


