The Semiconductor Index (INDEXNASDAQ: SOX) looks like it’s in trouble from a macro perspective.
Several techniques are pointing to a major SOX Semiconductor top here. Let’s elaborate.
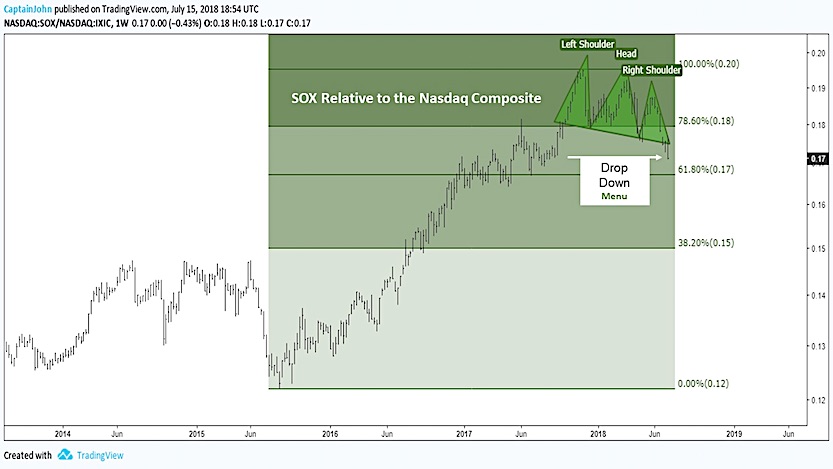
The Semiconductors are a member of the Tech universe and they are breaking down, making lower highs and lower lows relative to the Nasdaq Composite (INDEXNASDAQ: .IXIC).
The $SOX index has reached a Fibonacci extension at 1.618%, and the elliptical Fibonacci curve drawn is at 3.618. That is the Golden Mean to the Power of 3.
Notice how twice as it approached the 3.618 ring, price retreated? At times, in declines, price hugs that ring and follows the curve down.
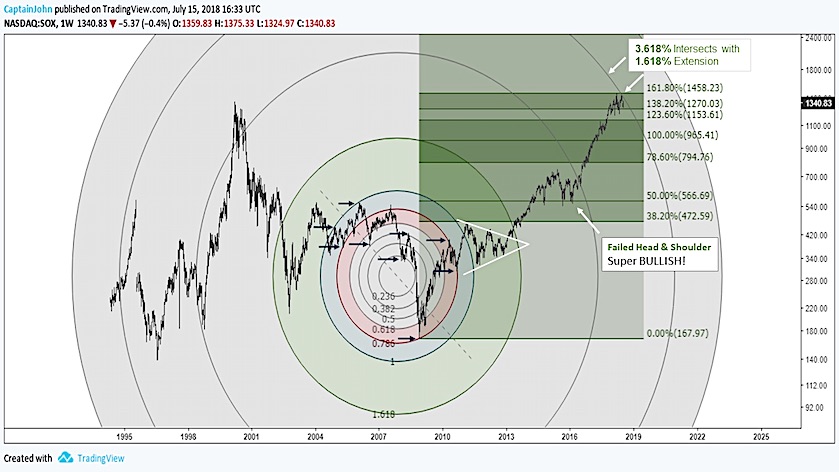
Relative to the Nasdaq Composite, the chart appears as a structure about to topple over with a right leaning Bearish Head and Shoulder Pattern. The Semiconductor sector is clearly under performing Nasdaq.
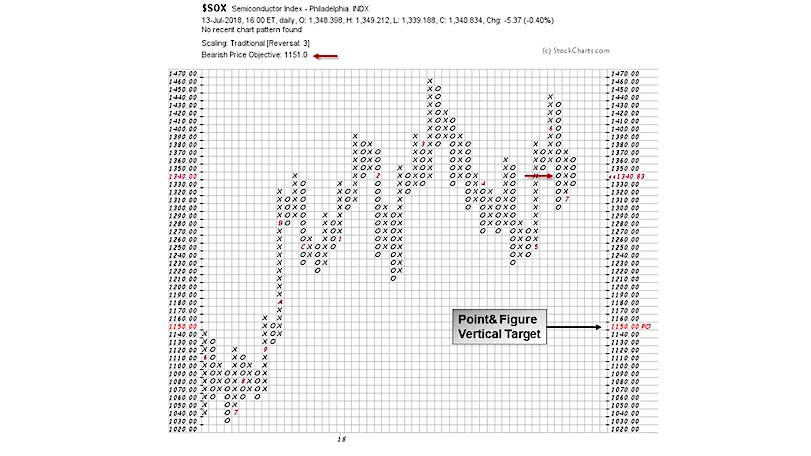
The Point and Figure vertical price objective of the $SOX Index is Bearish!
The target price is 1151.
Twitter: @CptJohnCharts & @FortunaEquitis
The author may have a position in mentioned securities at the time of publication. Any opinions expressed herein are solely those of the author, and do not in any way represent the views or opinions of any other person or entity.
")


")
