The S&P just published its operating earnings estimates for S&P 500 companies for 2017, and it is an eye opener. And they are even higher than their lofty 2016 operating earnings estimates.
Depending on one’s bias, reaction can range from ‘yee-haw’ to ‘not again’.
The consensus for 2017 expects a whopping $141.11.
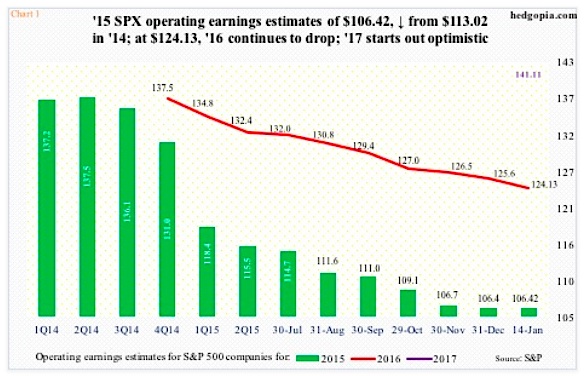
To put things into perspective, with 4Q15 currently being reported, 2015 estimates are down to $106.42. Actual operating earnings last year were $113.02. 2016 operating earnings estimates are expected to rise a healthy 16-plus percent, and 2017 nearly 14 percent on top of that (see chart 1 below).
All good, except these estimates have shown a tendency to paint a rosy picture out of the starting blocks, only to get revised downward as time passes.
S&P 500 Operating Earnings Estimates – In Decline
Take 2015, for example. At the end of the second quarter of 2014, operating earnings estimates were $137.50, before coming under persistent downward pressure. They are now nearly 23 percent lower. How well does that bode for 2016 operating earnings estimates?
Well, as early as February last year, 2016 was expected to bring in $137.50; as of January 14th of this year, they stood at $124.13. Even to meet these lowered 2016 operating earnings estimates, a lot of things have to go right, not the least of which is acceleration in the U.S. economy and stability or a rise in crude oil prices.
That is assuming a lot, particularly considering the economy is only six months from completing its seventh year of expansion, and that, should data permit, the Fed is itching to continue to tighten.
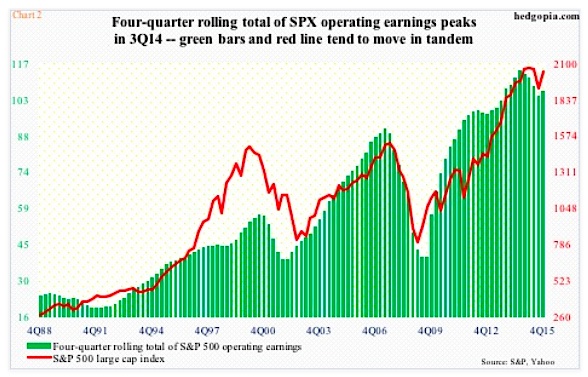
The cycle is long in the tooth, and it is vividly seen in Chart 2. The green bars represent the four-quarter rolling total of S&P 500 operating earnings, and it peaked at $114.51 in 3Q14, dropping by 4Q15 to $106.42.
2016 Operating Earnings Steadily Declining… But Still Lofty
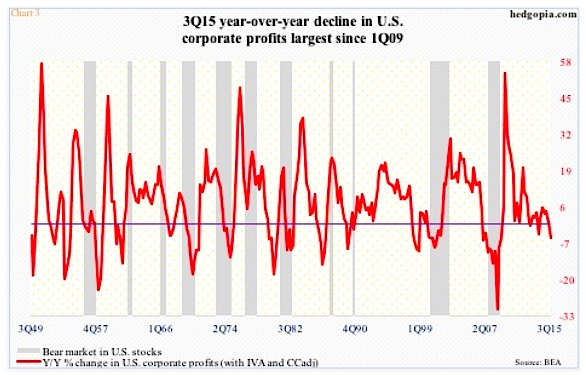
Incidentally, U.S. corporate profits adjusted for inventory valuation and depreciation peaked in 3Q14 as well – at $2.16 trillion. By 3Q15, they had dropped to $2.05 trillion – down 5.1 percent year-over-year. This was the largest y/y decrease since 1Q09. The red line in Chart 3 below is not headed the right direction.
Corporate Profits Largest Decline Since 2009
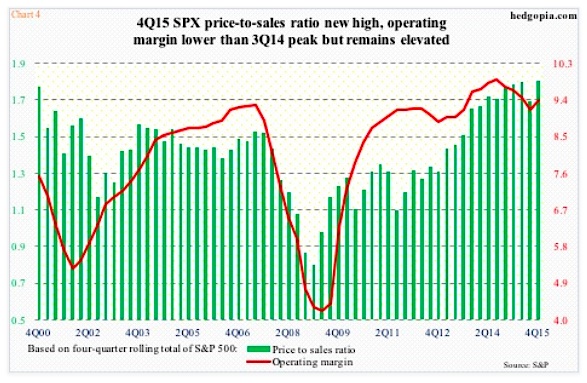
With 2016 operating earnings estimates in deceleration mode and operating margins having peaked in 3Q14 (chart 4 below), it is not prudent to take 2016/2017 estimates at face value. Particularly so considering the elevated price-to-sales ratio. As of 4Q15, it stood at a record 1.81. This compares with 1.52 in 2Q07 and 1.77 in 4Q00.
When may this not matter? If sales accelerate. In other words, if the GDP accelerates. The consensus currently expects real GDP to decelerate to 2.4-percent growth in 2017 from this year’s expected 2.5 percent.
S&P 500 Price To Sales Ratio Chart
There is the rub.
As is the case with earnings, consensus GDP forecast has tended to start out optimistic, only to get progressively revised downward. Toward the end of 2014, the economy this year was expected to grow 2.9 percent, which has now been cut to two percent. Things are decelerating… the economy grew 2.4 percent in 2014.
Customarily, the consensus expects things to reaccelerate this year, but likely meets the customary fate – downward revision.
Thanks for reading!
Twitter: @hedgopia
Read more from Paban on his blog.
Any opinions expressed herein are solely those of the author, and do not in any way represent the views or opinions of any other person or entity.
: Creating Bullish Divergence?")


 and Semiconductors (SMH): Concerning Price Pattern?")


