Hard Evidence Was Helpful Near Major Stock Market Tops & Turns
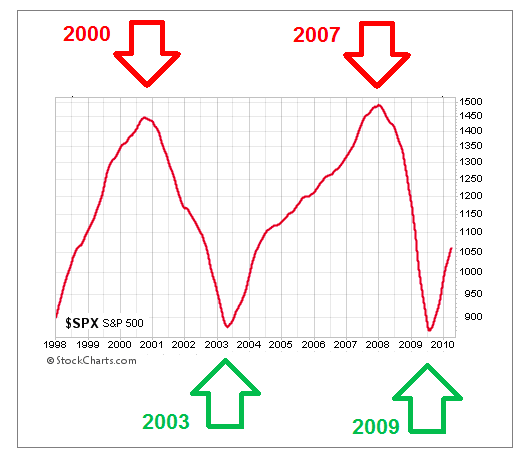
The chart below shows the S&P 500’s 200-day moving average between 1998 and 2010. Given the S&P 500 Index (INDEXSP:.INX) dropped by over 50% on two separate occasions in that period, it was helpful to have tools to monitor the market’s risk-reward profile.
Identifying when risks are higher can help us see the potential for a major stock market top and make adjustments.
Stock market tops as seen through the 200 day moving average:
So What Are The Charts Telling Us Today?
This week’s stock market video goes beyond the S&P 500 to help us gain a better understanding of the market’s bigger picture and current tolerance for risk. Numerous markets are covered, including gold, silver, and energy. The broader analysis can provide insight beyond the widely followed S&P 500.
Thank for viewing and have a great weekend.
Twitter: @CiovaccoCapital
Read more from Chris on the CCM website.
The author or his clients may hold positions in mentioned securities at the time of publication. Any opinions expressed herein are solely those of the author, and do not in any way represent the views or opinions of any other person or entity.


 Testing Important Price Support")


