The market is about to enter the month of September which many investors view as a historically negative month in the trading year.
Also called the September effect some analysts attribute a selling from investors rebalancing their portfolios at the end of the summer.
However, is the September effect something we should be worried about?
It’s possible the September effect has turned into a self-fulfilling prophecy of investors expecting a selloff and therefore they sell and create the negative month.
Another idea is that many mutual funds have a fiscal year-end in September and therefore by rebalancing their portfolios through selling weak stocks they help create a negative impact.
Keeping that in mind as we enter September, here are three important symbols that can guide us through market strength or weakness.
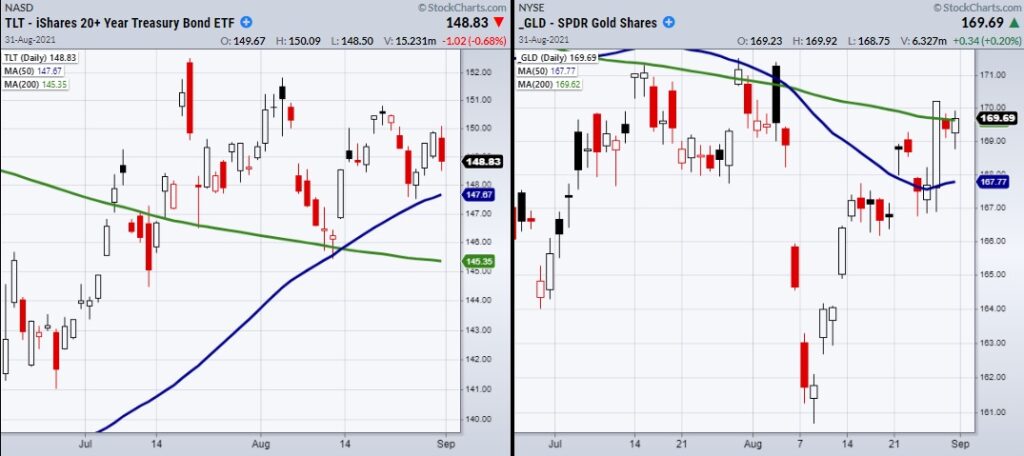
The Gold ETF (GLD), High Yield Bond ETF (JNK), and the 20+ Year Bond ETF (TLT).
Gold and Long-term bonds can be viewed as safety plays while High Yield Debt (JNK) can be used as a risk on gauge.
JNK is a risk on indicator because it shows investors’ appetite for risky high-yielding investments.
Currently, GLD is attempting to hold over the 200-Day moving average while TLT’s has support at the 50-DMA as seen in the above chart.
If we see more strength in TLT’s this coming month, we should be careful as it could be signaling more weakness.
However, rising GLD prices may come in the form of people looking for safety but also people looking for protection from rising inflation.
That means gold could have a better chance of rising along with the overall market.
On the other hand, JNK is sitting near new highs confirming a risk-on market environment.
Therefore, we should keep a positive expectation for September while watching these three symbols as they could hint towards coming market weakness or extra strength.
Watch Mish’s most recent appearances on both Fox Business and RT: Boom Bust!
Fox Business: Making Money with Charles Payne 8-31-2021
Stock Market ETFs Trading Analysis and Summary:
S&P 500 (SPY) 447 support level.
Russell 2000 (IWM) 225 support to hold.
Dow (DIA) 356.60 high to clear. 351 support.
Nasdaq (QQQ) Holding near highs.
KRE (Regional Banks) 67.22 recent high to clear. Needs to stay over the 50-DMA at 64.32.
SMH (Semiconductors) 264.22 support the 10-DMA.
IYT (Transportation) Needs to get back over the 50-DMA at 255.60.
IBB (Biotechnology) 173.69 to clear.
XRT (Retail) Needs to get over 97 and hold.
) 147.79 support the 50-DMA.
USD (Dollar) Doji day. Needs to hold the 50-DMA 92.59.
DBA (Agriculture) Breaking down from highs. Flirting with the 10-DMA at 19.15.
VBK (Small Cap Growth ETF) 292.55 support.
Twitter: @marketminute
The author may have a position in mentioned securities at the time of publication. Any opinions expressed herein are solely those of the author and do not represent the views or opinions of any other person or entity.

: Worrisome to Broader Market?")

