Amid the constant struggle between market caps for relative strength supremacy, the rumors of the death of small cap outperformance have been greatly exaggerated. Long live the death of small caps.
Many of the arguments in circulation heralding the end of the age small cap relative strength are re-baked variations of the same basic fundamental theme: the impossibly high P/E ratio.
According to Birinyi Associates (via the WSJ), the Russell 2000’s (RUT) (TTM) P/E printed last Friday at an absolutely staggering 83.69; by comparison, the previous rolling 12-month period was 34.60. Estimates of the small cap benchmark’s NTM Forward P/E come in at similarly elevated 19.55.
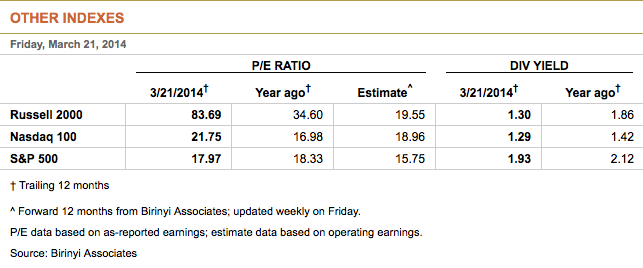
Additionally (and importantly for the present environment, as we’ll see) Russell itself does us the service of backing out the data of companies with negative trailing P/Es, rendering a TTM P/E ex-negative earnings at 22.37 (here).
Arguments suggesting small cap outperformance will soon end on the basis of unsustainably elevated P/Es are everywhere. Some cursory searching demonstrates they have been for years. And yet, their appeal for a rational reversion to that elusive mean of “realistic” valuations – at least, relative to large caps – goes unheard by the market.
In fact, this condition is the fundamental analog of the Russell 2000’s perennially overbought momentum (such as on its RSI). Countless compelling polemics have been made against the index’s stratospheric collective valuation and indomitable trend strength. As fellow See It Market contributor Robert Lesnicki often likes to tautologize, “it doesn’t matter until it does” – and so far this cycle, none of it has. Just like technical momentum measures, these figures are often pressed into the service of a task (timing) for which they’re ill-suited. Neither set of metrics is purpose-built to act as a predictive timing tool, but simply express a present market condition. So what – if anything – of value are these basic P/E measures saying about the Russell 2000?
Consider the yawning disparity between R2k’s unadjusted Trailing (83.69) and Forward P/Es (19.55) from the table above. The first number denotes a market so enamored with the promise of future earnings that it’s uninhibited impulse to bid up small cap asset prices can only be described as quixotic. And the second number – radically different but oddly complementary – is indicative of an analyst community convinced that last year’s bloated valuations will (finally?) be justified by radically increased earnings. The gap between these figures has never been so persistently high.
How about Russell’s ex-negative earnings TTM P/E? The inspiration for this measure derives from the notion that the concept of a negative P/E is invalid and even unintelligible; after all, isn’t the concept of “negative earnings” something of an oxymoron (and, coincidentally, embarrassing)? Because of the preponderance of money-losing small cap companies in the Russell 2000, Russell creates (and publishes, to the exclusion of the wider ratio) a fictive world in which these stocks are simply exempted from consideration. In that place, the list of stocks carrying around negative P/Es are nothing more than a null set to be shuttered away in a statistical purgatory.
Back here – where investors are allocating actual capital into actual companies with tangible consequences – a negative P/E (logically nonsensical or no) is crucial data. Any company – whether coming or going – with a negative P/E has negative earnings. In so many words, it bled money over the last 12 months.
Over the latest such period, the Russell 2000’s Trailing 12-MOnth P/E including negative earnings has risen 141% – from 34.6 to 83.69 – while the figure excluding negative earnings has increased less than 10% to 22.37. Despite this modest increase ex-negative earnings is now 25% above it’s historical average.
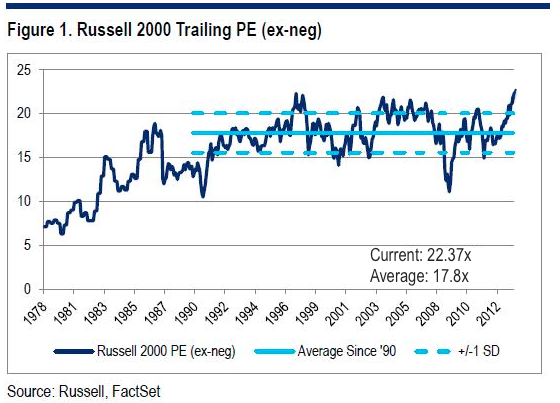
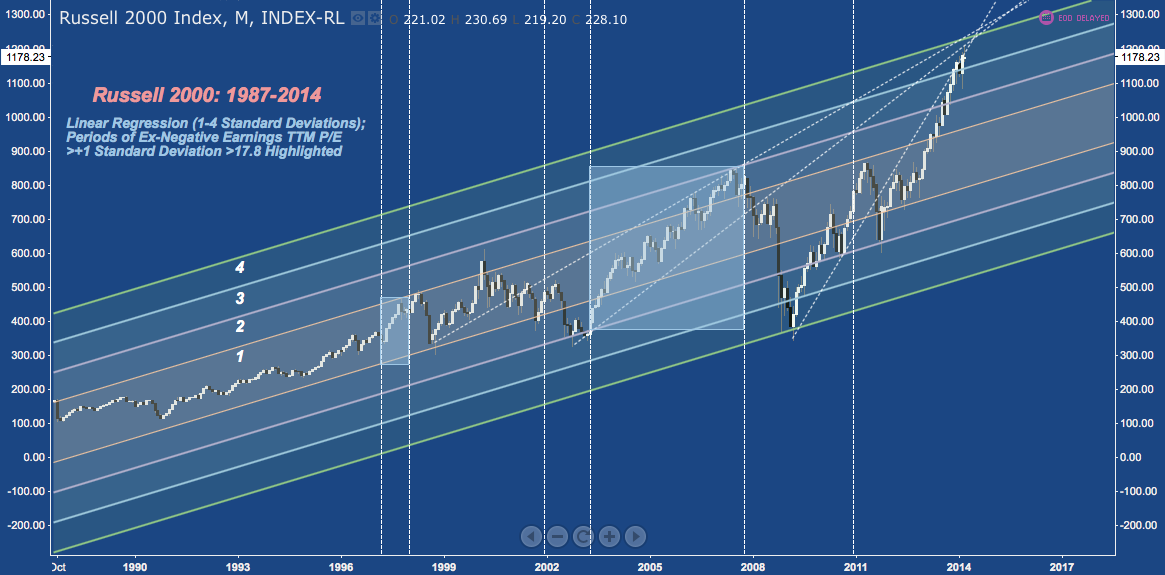
That’s as extended as it gets; but it’s worth noting that this condition can persist for long periods, as it did in mid-late 1990s and especially in the mid-2000s. Now compare these bouts of extreme valuation in the context of the Russell’s secular up-trend. How does the present spot in the prevailing trend stack up against these other occurrences?
And on the question of relative market strength? Here’s the Russell 2000 v. S&P 500 (SPX) over the same period, noting the same periods where the ex-negative earnings trailing P/E was more than one standard deviation above it’s long-term average of 17.8:
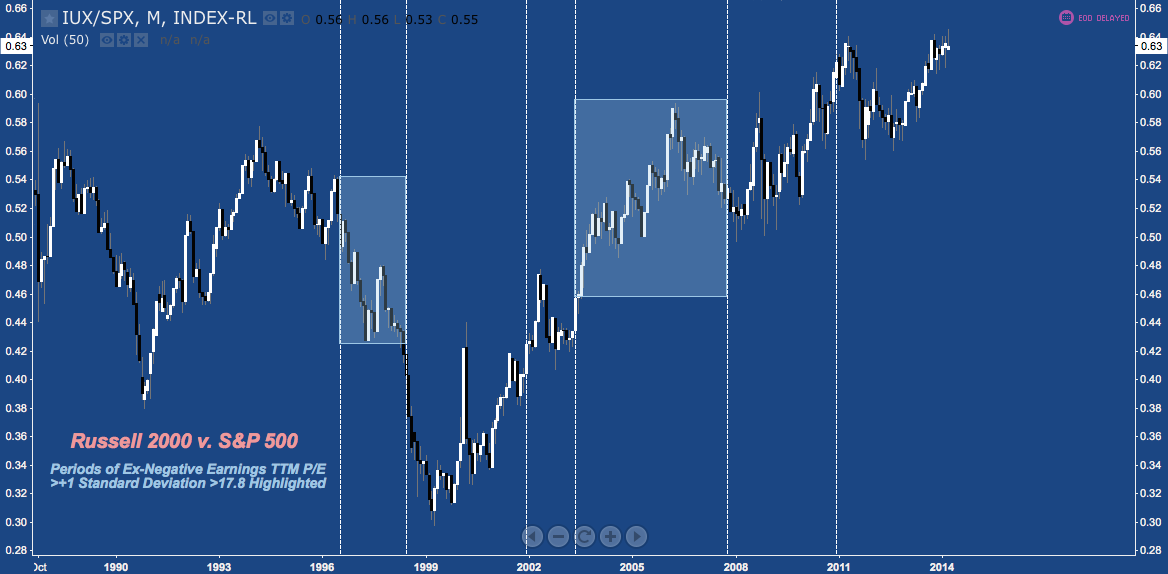
There’s no way around it: 1) the Russell 2000’s performance has been superlative since 1999; and 2) at relative and absolute all-time highs, the index looks incredibly tired.
But: isn’t the lesson here that it can just get more tired?
On that question the ex-negative earnings TTM P/E is highly instructive. Using the measure in isolation is transparently delusional. In context, however: it’s anything but worthless. The disparity noted above in growth between the adjusted and unadjusted TTM P/Es in the Russell 2000 reveals that it is those companies with negative earnings that actually drove the numerator of the unadjusted figure year-over-year. It isn’t enough to note the fantastic absolute performance of the Russell 2000 over the last 12 months: the ratio of TTM P/E growth to TTM ex-negative P/E growth indicates the capital inflows that have benefited the index have been overwhelmingly allocated to unprofitable companies.
Simply put: investors paid (and continue to pay) ever-higher prices for companies that hemorrhage money in the almost entirely vain hope of organic earnings growth that doesn’t appear.
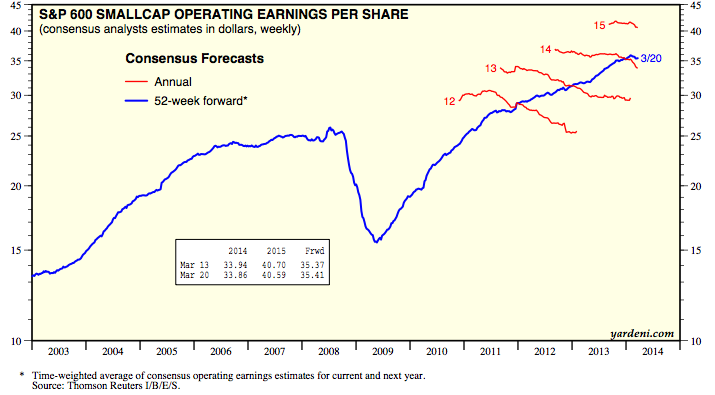
In fairness, the Magic 8-Ball of Forward P/Es says this is about to radically change. But as Yardeni Research notes on the S&P’s small cap index (SP600), the analytical community chronically errs (to put it politely) on the side of optimism, only to be drug lower time and again:
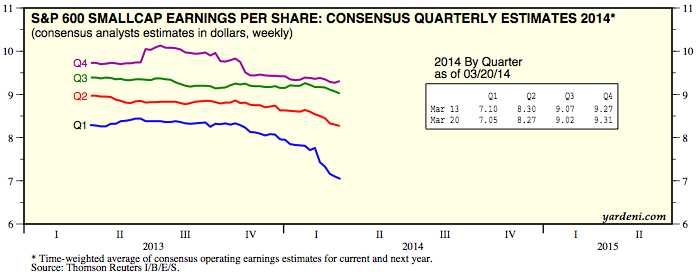
And SP600 operating earnings estimates for the current year (check out the Q1 dump in February):
Nevermind tactics and timing: they are better left to other tools. As a simple expression of the current market condition, small cap P/Es are conveying immensely powerful message: the period of relative and absolute small cap outperformance is drawing to a close.
Twitter: @andrewunknown and @seeitmarket
Author carries net short Russell 2000 exposure at time of publication. Commentary provided is for educational purposes only and in no way constitutes trading or investment advice.
“Wars and Rumors of Wars” courtesy of the “Wars and Rumors of Wars” album art by The Chariot. Russell 2000, Russell 2000 v. S&P 500 charts courtesy of tradingview.com
Any opinions expressed herein are solely those of the author, and do not in any way represent the views or opinions of any other person or entity.


")

