
Planetary Stations to Gauge Time and Price
In February, I wrote a blog about Google (GOOG), introducing price and time analysis.The same concept of applying planetary stations as potential resistance for individual securities can also be applied to the market as a whole. In this article we will stack the market up against the stations and evaluate the varying aspects to see what may be on the horizon for the financial markets.
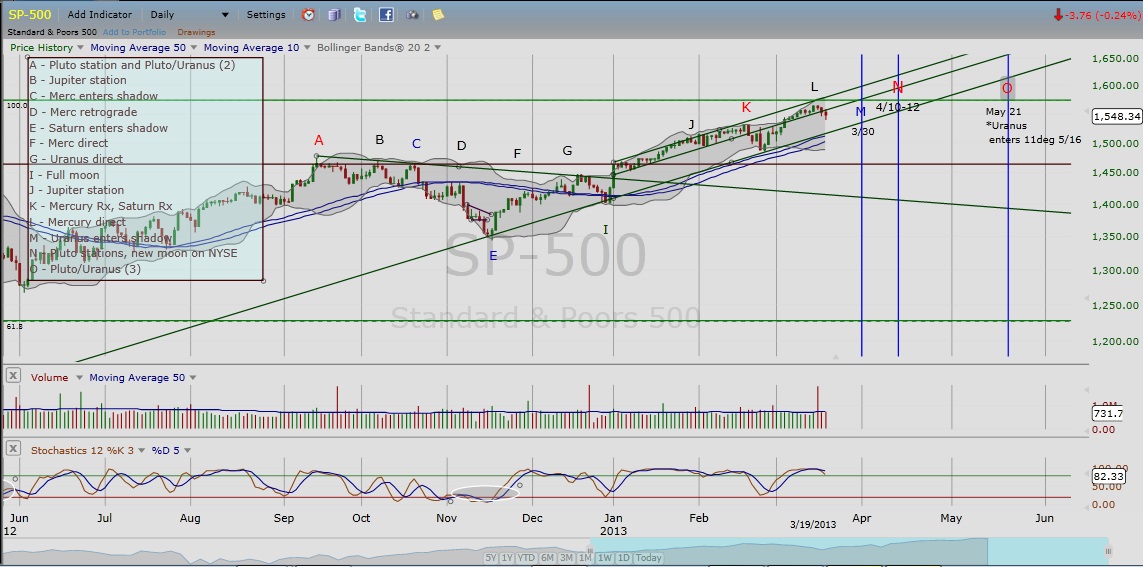
The S&P 500 through June 2013 – Planetary stations chart (click to enlarge chart)
Source: Freestockcharts.com
The chart above of the S&P 500 shows planetary stations and other major planetary aspects since the Pluto station on September 17, 2012; this date coincided with the peak of the S&P 500 (i.e. the end of the fall 2012 uptrend). The blue vertical lines represent planetary stations and other major planetary aspects forward in time. As well, here are a few definitions/terms to bear in mind: In astrology, retrograde refers to a time when (from Earth) a planet appears to reverse course and move backward in the sky. The illusion of backward motion is created by the nature of the planets’ elliptical orbits. Stations are the points in time when a planet appears to stop and reverse motion, either retrograde or returning direct.
With this in mind, think of the letter “Z”: a planet moves forward, reverses direction and tracks backward, before regaining its forward direction. A planet is said to be in its retrograde shadow from the time, while direct, it crosses the point when it will station direct after its retrograde phase. For example, Pluto will station at 10 degrees, retrograde back to 6 degrees, and then resume forward motion. Pluto is considered to be in its shadow from the time it crosses 6 degrees before going retrograde. It remains in its shadow the entire time it is retrograde and until it returns to 10 degrees. While stations or retrogrades are not physical phenomena, perception plays an important role in how we perceive reality, physical or otherwise, and is an important concept applied for both astrology and market technical analysis. The market is said to be a leading indicator of the economy because it represents our expectations of the future.
The hypothesis I have shared on my market blog since the wall of worry began to escalate in early February was the expectation that the wall of worry would continue until late March to mid-April. Noted in the chart above, late March is when Uranus will enter its shadow or when it will be at the same degree when it stations direct this coming December. Moreover, the next Pluto station this April can be seen as part of the larger cycle related to the Pluto station last September when it stationed direct. Oye, what was that again? Compare the chart above to the chart below, which was drawn March 5, and notes significant market events in the recent past that coincide with the respective planetary stations or other major planetary aspects. Click to enlarge.
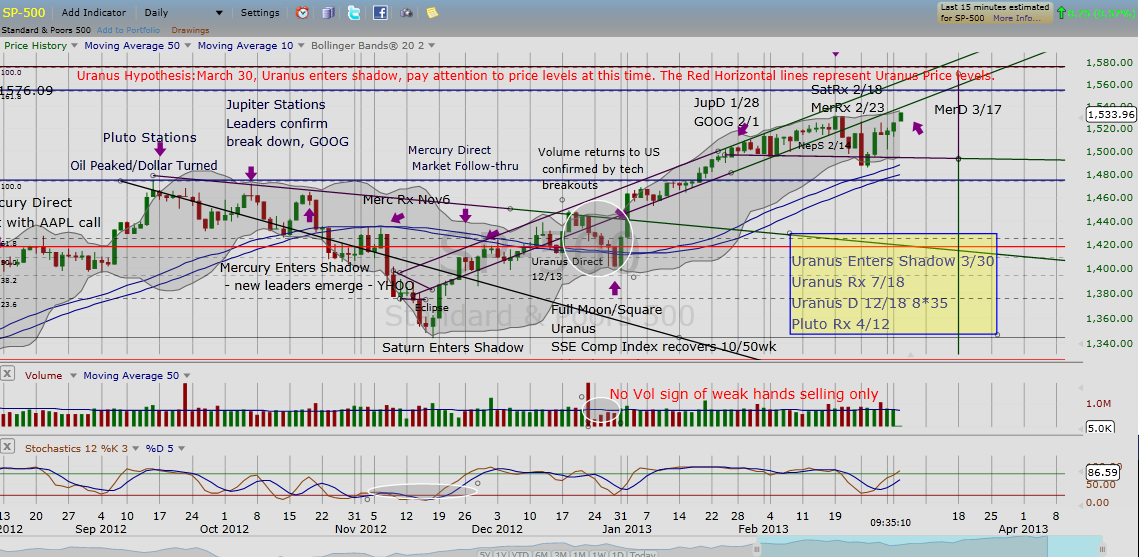
At the Pluto station around September 17, this period coincided with light crude oil futures peaking and the dollar index forming a harami (candle reversal pattern). At the Jupiter station, October 5, NASDAQ leader Google peaked along with other leading technology names. We can see the next peak around October 18, when Mercury entered its shadow. And again, the day after the Mercury Retrograde on November 6, which coincided with the Presidential elections, the S&P500 sold off significantly the following day.
Visually, we can see the build-up of significant planetary stations and patterns. To explain our late-March/mid-April target for the end of this months-long uptrend, we noted the build-up of the planetary stations that began with Jupiter in late January, coinciding with GOOG breakout, and end with the Pluto station in mid-April. The next block of time that planets will appear to station will be this summer.
It is important to remember that just as markets do not necessarily peak or bottom at defined price levels (using Fibonacci analysis or other methods) on the y-axis, the markets do not necessarily peak or bottom at defined times on x-axis. However, both price and time analysis provide guideposts for when to begin looking more closely at market action and help block out the daily noise for intermediate traders.
References:
- Price charts courtesy of Freestockcharts.com
- Astrology charts and data courtesy of Astro.com
Twitter: @RinehartMaria and @seeitmarket
No position in any of the mentioned securities at the time of publication.
Any opinions expressed herein are solely those of the author, and do not in any way represent the views or opinions of any other person or entity.


")


 Ready To Break Out?")