By Maria Rinehart I came upon financial astrology by chance after receiving a spam e-mail promoting Exxon (XOM). This was the spring of 2008. Not having much knowledge about the markets, I drew up a horary chart for XOM with the simple question, “Should we buy it?” The answer was, “It was too late.” The “answer” would require a study of oil and its cycles to understand the why. The why would lead to more whys. In July, we highlighted at Astro.com, a popular astrology website, the similarities between the October crashes in 1929 and 1987 to planetary transits coming up at the end of September. On September 29, 2008, the Dow fell 700 points.
Whether the call on XOM and timing the end of September crash were pure beginner’s luck, it inevitably was the start of a journey. We made a few other calls that fall including that Ford (F) would be coming up on crisis by December 2008, and the expectation that Netflix (NFLX) IPO would once again try to beat its all-time high by the spring of 2009 as measured by the Saturn cycle. The astrology “predictions” came to pass, however, as with the question of oil above, the “why” was yet unclear. Moreover, astrology predictions that highlight potentials do not necessarily translate to how to trade this knowledge offers but one piece of the puzzle. Therefore, like others before me, I began a study of the markets from both its fundamental and market technical aspects. What soon became obvious was the potential to integrate financial astrology with traditional fundamental and technical tools.
Price and Time Analysis
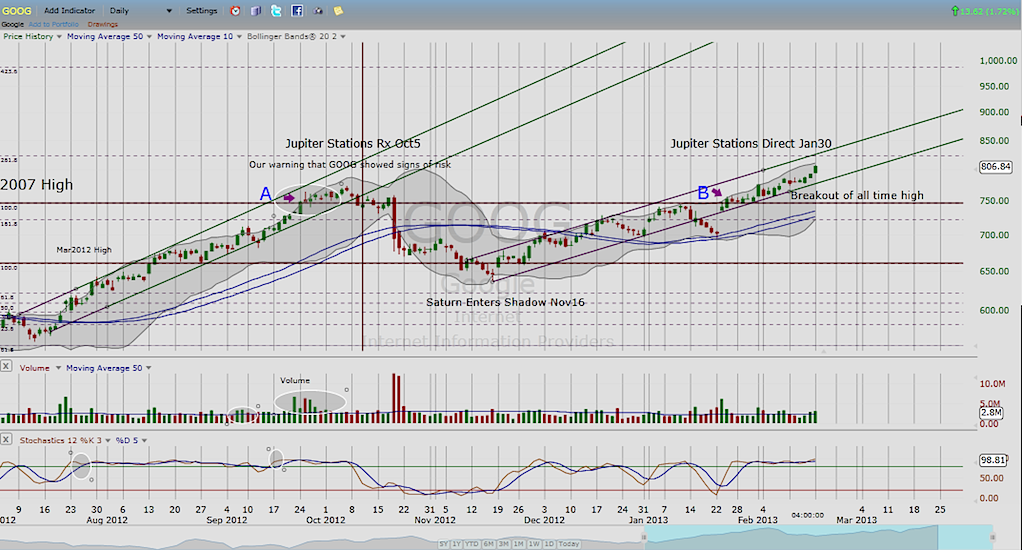
Fibonacci analysis is a common method to identify important support and resistance levels. In a bullish uptrend, the technician can assess the action at the next resistance to gauge whether it still has room to rise or whether the bears are now gaining advantage. The chart of Google (GOOG) above at (A) shows the stock at its 2007 high and displaying warning signs that the uptrend that began in late summer was at risk. Note the rising volume and churning action at the resistance. High volume is good to see early in a trend to confirm that there is support behind the move, but late in a trend can be a warning sign of near term exhaustion. In this case, warning was confirmed by candle action, and inability to breakout above resistance despite rising volume.
Financial astrology can be used for the time half of time and price analysis to identify points in time that are ripe for a trend change or continuation. The planets elliptical orbit creates a visual perception from earth that the planets at times travel in reverse. This visual perception highlights an important philosophy in astrology that perception is half reality. The period when a planet appears to slow and retrograde in motions is defined as when the planet is stationing in order to reverse its course. This period often marks an important point in time for a potential trend change or strong continuation. These points in time, similar to price support and resistance can be used to mark on the x-axis of the price chart when one can expect either a continuation or an interruption of the current trend verified by other traditional technical tools. In this case, Pluto stationed September 17, and Jupiter would station October 5. October 5, on the chart, marked the peak of Google before selling off strongly later that month.
Jupiter Stations four months later, January 30, 2013
Jupiter stations again on January 30. February 1, GOOG stock broke above the 2007 high and price action and volume this time supports a continuation of an uptrend that began with the market follow-thru in late November. It is not so much about predicting, but noting the behavior of the stock and the markets at key points in time and price support and resistance levels.
Both the rising risk behavior of GOOG in late September and the breakout in February were noted in the Latest Update section of our blog.
Isolating the Daily Noise
We are in an age when we are inundated with information on a constant and daily basis. The purpose of identifying key price support and resistance levels is in a way a method to drown out the daily noise on the charts; similarly, identifying times that are ripe for a trend change or continuation helps to drown out this daily noise whether in the media or in the price charts.
About Maria Rinehart: Maria is a market analyst and a financial astrologer who had studied astrology as a hobby for nine years prior to discovering a passion for the markets in 2008. That summer she timed the September 29th crash within a day. Primary market influences are Jesse Livermore and IBD’s Bill O’Neil; thus, she has tailored a financial astrology methodology to fit a growth methodology with an intermediate time-frame. She posts regularly at mariarinehart.com. You can follow her market updates on Twitter.
Twitter: @RinehartMaria and @seeitmarket
No position in any of the mentioned securities at the time of publication.
Any opinions expressed herein are solely those of the author, and do not in any way represent the views or opinions of any other person or entity.

: Cup (and Maybe Handle) Watch")
 Reaches Important Price Support")

