This week is perfect to be discussing U.S. housing dynamics as the March sales numbers for existing and new homes were just published. The report was mixed. Sales of existing homes rose 6.1 percent to an annual rate of 5.19 million units – the highest since 5.26 million in September 2013. New home sales were weak, down 11.4 percent to an annual rate of 481,000 units; although February, at 543,000, was highest since February 2008.
Household formation has been weak in recent years. This changed last year, as two million new households were formed, even as the U.S. population grew by 2.2 million.
This is all well and good, but in the larger scheme of things housing could do a lot better. The sector has taken time to recover. The current U.S. expansion is already in its sixth year.
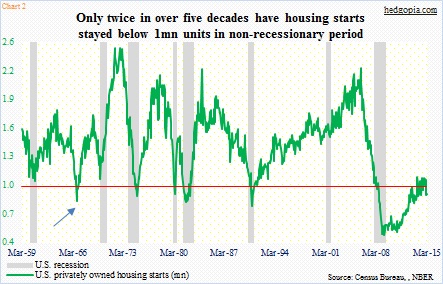
Take housing starts, for instance.
In both March and February, starts were under a million (at a seasonally adjusted annual rate). The housing data series in Chart 2 goes back to 1959, and it is rare for starts to dip below the million mark. As a matter of fact, the only other time this has taken place in a non-recessionary period was in October-December 1966 (blue arrow). Except for those two occasions, a dip below one million has been accompanied by a recession.
This is not to suggest that we are in the midst of a recession, or even approaching one, just that this cycle has been very different from the past.
Weak housing starts have potential to be both a boon and a bane.
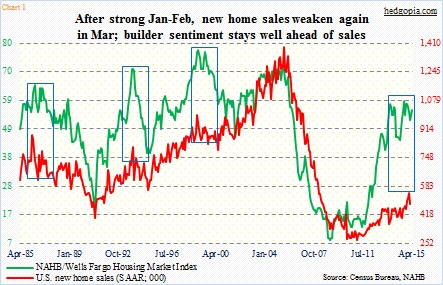
First, the positive. In March, there was 4.6 months’ supply of existing homes, down from 5.6 as early as last August. In new homes, supply rose month-over-month to 5.3 months, but was down from 6.2 last July. Is this the reason why builder sentiment has persistently remained elevated?
In fact, builder sentiment has stayed way ahead of both new home sales (Chart 1) and housing starts. If history is any guide, sooner or later they converge; either sentiment follows sales lower, or sales follow sentiment higher.
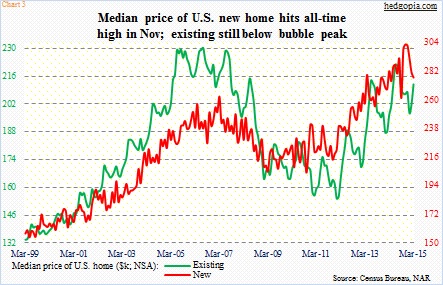
The downside to subdued housing starts is on the price side. The median price of a new home stood at $302,700 last November – an all-time high. Yes, higher than during the bubbly middle part of the last decade. March was down 1.5 percent, to $277,400. The price of an existing home never took out the July 2006 peak of $230,400 but has been trending higher in a saw-tooth pattern; in March, it rose five percent month-over-month to $212,100.
Therein lies the problem. Price has been galloping ahead, other fundamentals not so much. Non-farm job creation has been healthy – 3.1 million in the 12 months to March – although dominated by low-paying jobs. Wages, on the other hand, have been disappointing. Year-over-year growth in average hourly earnings of U.S. private employees just cannot persistently stay north of two-plus percent.
So of the three important variables that go into deciding housing affordability, low mortgage rates are helping, while income and price are not – particularly the latter since it has already risen so much.
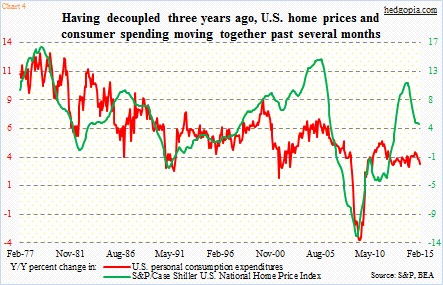
This not only is a sales deterrent but could end up playing an important role from another angle. Chart 4 plots personal consumption expenditures against S&P/Case Shiller national home price index. Year-over-year growth is used in both, and they have a tendency to track each other. About three years ago, they started to diverge, with the green line shooting up and the red line going sideways. The latter started to decelerate last August, matching the deceleration that has been going on in the green line.
When it is all said and done, this could just end up being noise. Or not. We have no way of knowing. Right at this moment, homebuilder stocks have not shown major concern. They do tend to follow builder sentiment, which as Chart 1 shows, has stayed persistently elevated, detached from the new-home sales truth. Using this logic, homebuilder stocks as represented by the Home Construction ETF (ITB) in Chart 5, have tons of good news priced in. The risk is, as has happened in the past, builder sentiment follows sales lower, and homebuilder stocks follow sentiment lower.
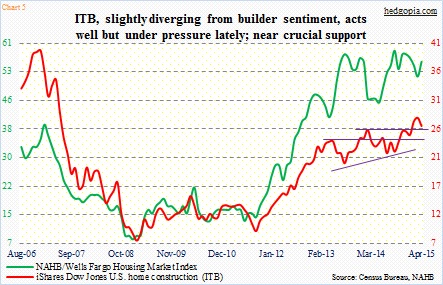
Technically, several weekly momentum indicators on ITB have started to turn lower. And with today’s early weakness, there is now a bearish MACD crossover. Yesterday, it was an up day for stocks in general. We also had better-than-expected existing home numbers. Yet the Home Construction ETF took out its 50-day moving average. On a daily basis, it is beginning to get oversold.
In short, ITB needs a close watch – see if the bulls step up and defend 26, then 24.
Thanks for taking the time to read this post.
Follow Paban On Twitter: @Hedgopia
No position in any of the mentioned securities at the time of publication. Any opinions expressed herein are solely those of the author, and do not in any way represent the views or opinions of any other person or entity.
: Showing Some Signs of Emerging Strength")


: Showing Some Signs of Emerging Strength")