USDA SHOCKS MARKET WITH MASSIVE U.S. CORN YIELD INCREASE IN AUGUST 2016 WASDE REPORT.
Friday the USDA released its much anticipated August 2016 WASDE report. The trade was keenly focused on what many believed would be the USDA’s first upward adjustment to its 2016/17 U.S. corn yield forecast.
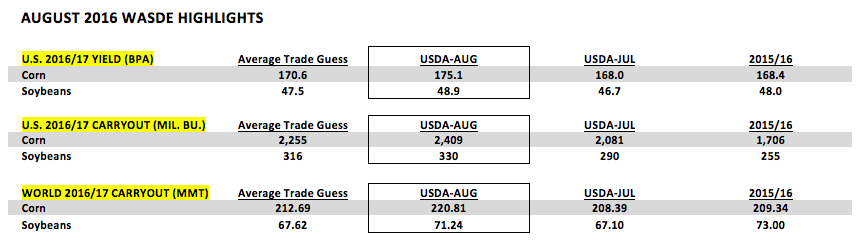
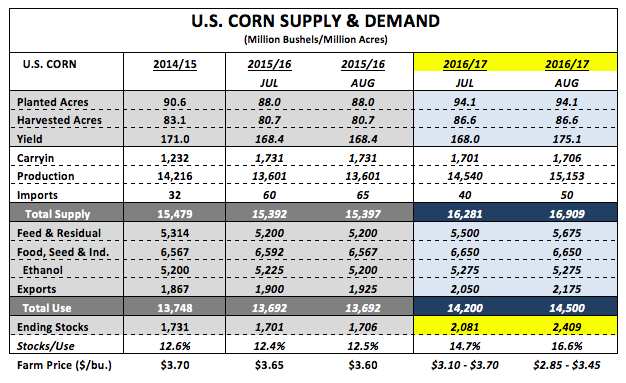
The USDA certainly did not disappoint, raising the U.S. corn yield to 175.1 bushels per acre. This represented a 7.1 bpa increase from their July estimate and was also well-above the average trade guess of 170.6 bpa.
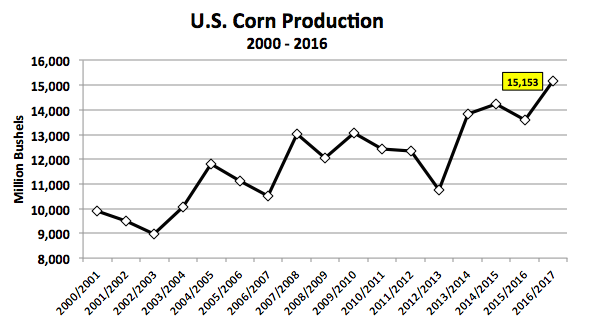
Total U.S. corn production swelled to 15,153 million bushels versus the July forecast of 14,540 million bushels and 13,601 million in 2015/16.
The USDA did its best to neutralize a supply-side, month-on-month increase of an incredible 628 million bushels by raising total 2016/17 U.S. corn demand 300 million bushels. However, that proved not nearly enough to prevent U.S. corn ending stocks from soaring to their highest level since 1987/88. The 2016/17 U.S. corn carryout jumped to 2,409 million bushels, up 328 million bushels versus July. This was 154 million above the average trade guess. Furthermore, the stocks-to-use ratio increased to 16.6%, the highest it’s been since 2005/06 (17.5%).
What was my immediate reaction to the USDA’s August U.S. corn yield estimate of 175.1 bpa? I believe it will serve as the USDA’s high-water mark now through the January 2017 WASDE report, which is when the USDA will make its final determinations on the U.S. corn yield, harvested acreage, and total production figures for 2016/17. After analyzing the USDA’s state-by-state yield projections they are currently assuming record yields in Iowa (197 bpa), Illinois (200 bpa), and Nebraska (187 bpa). Note that these are the 3 largest state corn producers in the country. Furthermore they have Minnesota’s corn yield forecasted at 184 bpa, just 4 bpa below its record from 2015. As well, they have Indiana’s corn yield estimated at 187 bpa, just 1 bpa below its record from 2014. Minnesota and Indiana are the 4th and 5th largest state corn producers in the U.S.
Ultimately I believe the 2016 U.S. corn harvest will show good, but not record-breaking final corn yields in all five aforementioned states (after average ear weights are considered). This still favors a U.S. corn yield closer to 170 bpa and total production of approximately 14,720 million bushels.
Weekly U.S. Crop Progress Update
On Monday, the U.S. corn crop experienced its first weekly decline in crop ratings this season. The national good-to-excellent rating dropped 2% to 74% good-to-excellent versus 70% in 2015 and 73% in 2014. Notable state decreases included Indiana’s good-to-excellent rating falling 4% to 73%, South Dakota down 3% to 55%, and Ohio down 7% to 47%. Collectively those 3 states accounted for 15.6% of total U.S. corn production in 2015 and 17.5% in 2014. Therefore they’re not inconsequential in determining the final U.S. corn yield.
That said the two largest state corn producers in the country, Iowa and Illinois, both saw their ratings unchanged at 83% good-to-excellent, which is now equal to or slightly above the record high pace they established in 2015 and 2014. The two percentages to watch however, which should influence the direction of the U.S. corn yield in the USDA’s September WASDE report, are 68% and 74%. They represent the good-to-excellent ratings for the U.S. corn crop as of August 30th in 2015 (68%) and 2014 (74%), and are synonymous with a final U.S. corn yield ranging from 168.4 bpa to 171.0 bpa. If corn ratings continue to slide this month (below 74% good-to-excellent) this could change the narrative regarding a U.S. corn yield above 2014’s record 171.0 bpa being a foregone conclusion for 2016, notwithstanding the USDA’s latest August yield estimate of 175.1 bpa.
Weekly U.S. Corn Exports
Weekly export sales for U.S corn totaled an impressive 63.4 million bushels combined for both old-crop and new-crop. Of that total 23.4 million bushels were for the 2015/16 marketing year, pushing year-to-date sales up to 1,954 million. This compares to the USDA’s revised 2015/16 export forecast of 1,925 million bushels in the August 2016 WASDE report. The USDA also increased its 2016/17 U.S. corn export projection to 2,175 million bushels, which if realized would be the highest since 2007/08 (2,437 million).
US Corn December Futures Price Forecast
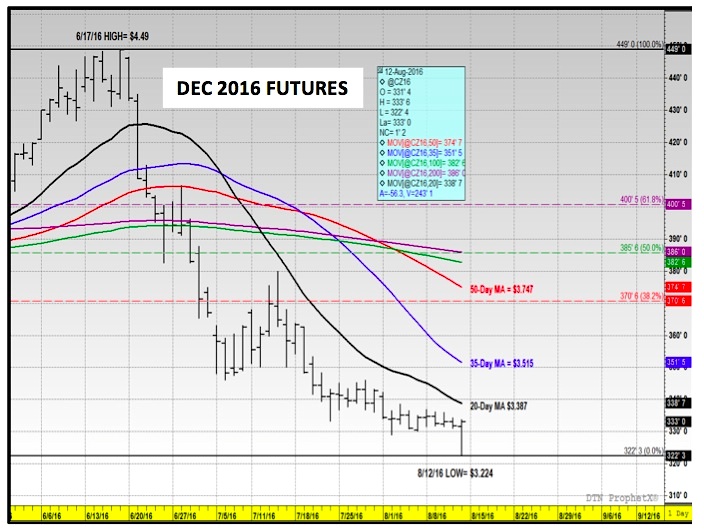
Despite December 2016 corn futures selling-off aggressively on Friday, momentarily dipping to a new contract low of $3.22 ½ following the release of the USDA’s August 2016 WASDE report, CZ6 actually managed to recover closing higher that afternoon. How is that possible with the USDA offering record yield projections for both the U.S. corn and soybean crops of 175.1 and 48.9 bpa respectively in that report? I would attribute it simply to market psychology and the perception that the August WASDE report has quite possibly issued the most Bearish U.S corn S&D outlook the market will now see for the remainder of the 2016 calendar year.
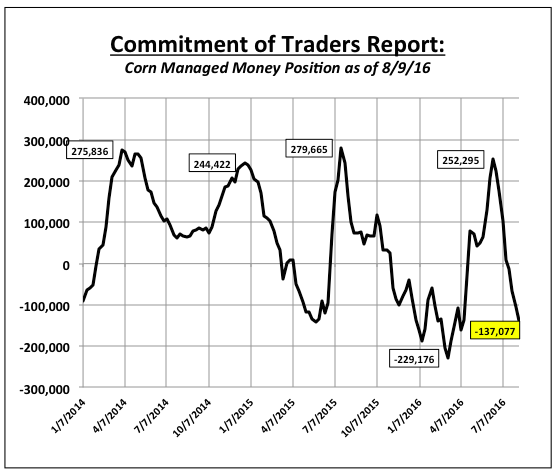
Money Managers have historically traded the trend in yield and ending stocks from month-to-month as opposed to the pure number.
Therefore if traders believe both the U.S. corn yield and ending stocks have potentially peaked in the August report, Money Managers could look to liquidate a percentage of their net corn short position (which increased to -137,077 contracts as of the market close on 8/9).
This same type of price action was reflected in September through November of 2014. That year the U.S. corn yield peaked in the October WASDE report at 174.2 bpa, which also coincided with the timing of the December corn futures harvest low of $3.19 (achieved on 10/1/14; within 10-days of the October WASDE report). However with the market assuming the real possibility of both yield and stocks declines looming in the November WASDE report, December corn futures abruptly stopped trending lower after the 1st week of October. In fact they rallied back 69-cents per bushel to a day high of $3.88 on November 13th, 2014. Did the USDA’s November 2014 WASDE report reveal Bullish U.S. Corn S&D adjustments? No, on the contrary the report showed the U.S corn yield at a would-be record high 173.4 bpa with U.S. corn ending stocks of 2,008 million bushels. HOWEVER both figures still represented a negative trend change relative to the previous month. I believe a similar price pattern could evolve in 2016 from August through mid-September (which is also consistent with the 5-year price seasonal) if traders take the position that the U.S. corn yield will likely be lower than the 175.1 bpa estimate just released on Friday.
Overall was there anything price supportive in the USDA’s August 2016 WASDE report? No, however even Bear markets eventually carve out a bottom when traders assume the worst of the negative news has finally been digested…
Thanks for reading.
Twitter: @MarcusLudtke
Author hedges corn futures and may have a position at the time of publication. Any opinions expressed herein are solely those of the author, and do not in any way represent the views or opinions of any other person or entity.
Data References:
- USDA United States Department of Ag
- EIA Energy Information Association
- NASS National Agricultural Statistics Service

: Worrisome to Broader Market?")


