Biotech stocks have been on fire in 2015. In the Biotech & Pharmaceuticals sector of the Russell 2000 Growth Index, there are over sixty stocks up by more than 30% this year. More than thirty stocks are up greater than 50% while six have more than doubled.
The iShares Biotechnology ETF (IBB) is already up more than 20% less than 3 months into the year. But this is nothing new for these technology-focused healthcare companies. Over the past three years IBB is up an astonishing 45% per year. Over five years it’s risen 33% per year. And over 10 years it has an annual return of 19%, good enough to double your money every three and a half years or so.
These gaudy returns have left many investors wondering how much longer the run can last and if the biotech sector is starting to reach bubble territory. The comparison that comes to everyone’s mind these days is the Nasdaq tech bubble from the late-1990s. I thought it would be interesting to take a closer look at the performance in biotech stocks to see how it stacks up with insane run in tech stocks before the bubble burst in 2000.
Here are the annual returns in Biotech stocks (using IBB) starting in 2011 along with the total and annualized returns through last Friday:
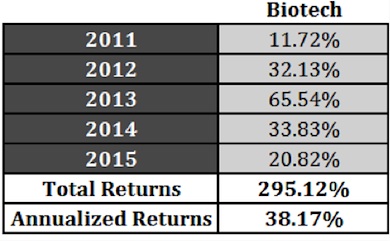
So in a little over four years these stocks are up almost 300%.
Not let’s see how the Nasdaq from the late-1990s looks in comparison. The Nasdaq was actually in negative territory in 1994 (-3.20%) so the run-up really took off at the beginning of 1995. Here are the annual returns starting in 1995 where the 1999 performance only goes through March of that year to show where both were up to that point:
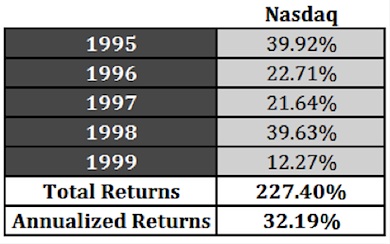
Surprisingly, you can see that biotech stocks are actually ahead of the Nasdaq four and a quarter years into each market’s run-up. But the Nasdaq really melted up the remainder of 1999, finishing the year up over 85% for a total five year gain of 441% or a return of 40% per year.
To match the entire five year stretch in the Nasdaq, the Biotech sector would have to finish 2015 up around 70% or so. That would be another 40% higher from today’s levels. If that were to happen, IBB would come close to matching the 24% ten year annual gains the Nasdaq had through the end of 1999.
Obviously, these are simply the returns for each market. I haven’t looked at valuations or the underlying companies, industries or market caps here. It’s not a perfect comparison by any means because that context is lacking. But the return profiles are starting to look eerily similar between biotech and the Nasdaq.
At this point nothing would surprise me as there’s a wide range of outcomes in-between a melt-up and a melt-down.
Follow Ben on Twitter: @awealthofcs
Any opinions expressed herein are solely those of the author, and do not in any way represent the views or opinions of any other person or entity.


