 Those expecting an uneventful Thursday as the US celebrates the Thanksgiving holiday have been greeted by just that as S&P 500 equity futures (ES) listlessly trudge sideways.
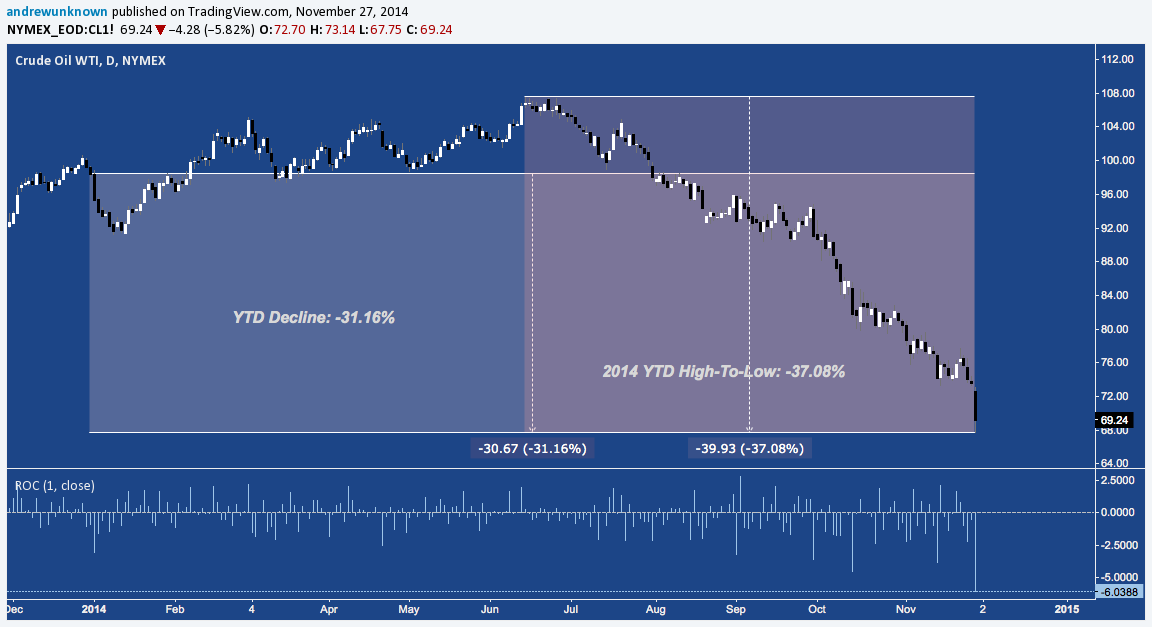
Elsewhere – in an asset class that’s highly uncorrelated, currently – conditions couldn’t be more different. WTI Crude Oil (CL – Quote) dropped as much as -8.06% session-over-session early today, and is currently down -6.28% to just above $69/bbl, representing the largest single day decline (on a closing basis) since 05/03/2011’s 8.26% fracking.
Year-to-date and since June’s peak at $107.68, Crude is firmly in bear market territory at -31.16% and -37.08%, respectively:
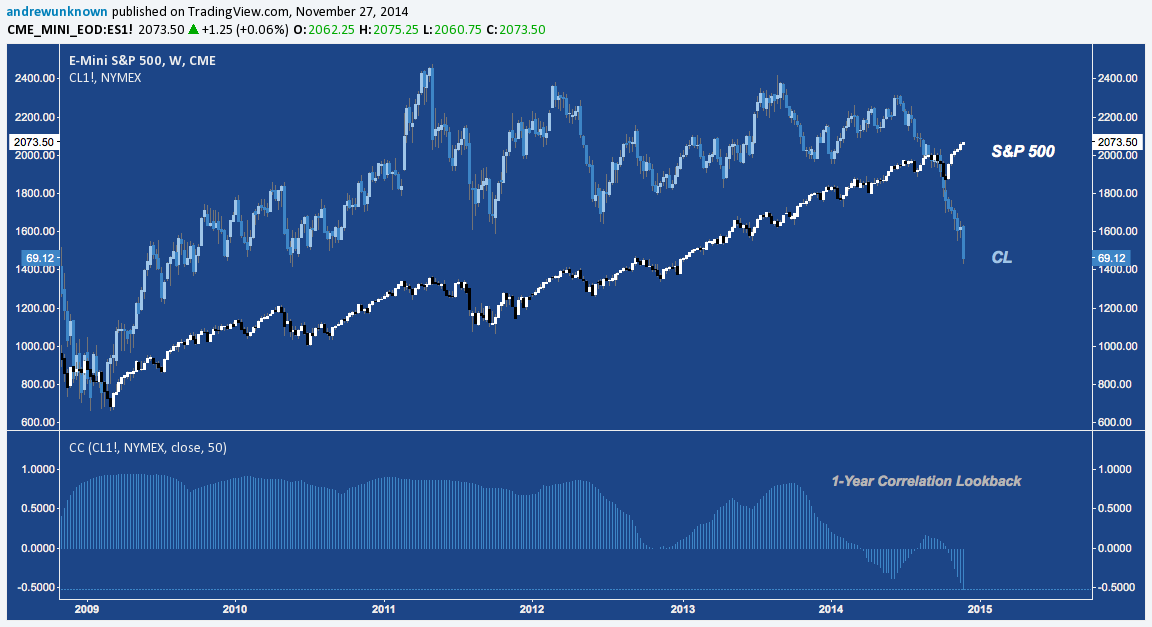
On a 1-year lookback across the current market cycle, Crude has entirely decoupled from US equities:
In fact, with today’s push, CL makes a firm move into the 2nd place for selloffs since 2008’s all-time high at $147.27/bbl.
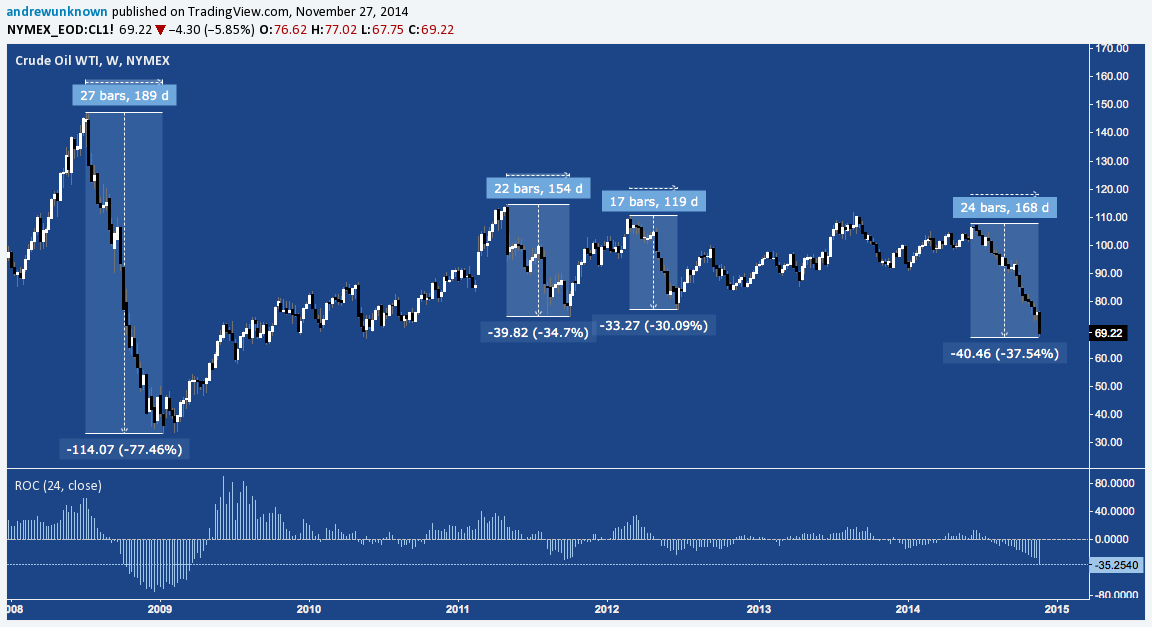
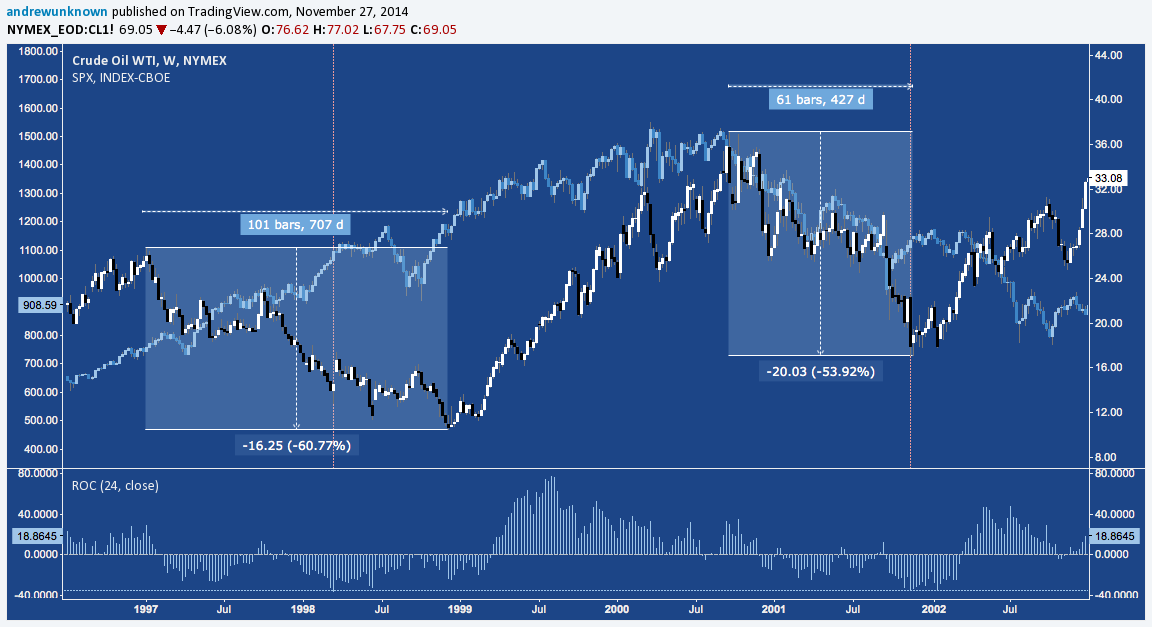
2008 notwithstanding, this is the largest drop since 2001’s -53% decline, and 1997-1998’s -61% drop before that. As an aside, US equities (S&P 500 – Quote) moved down in lockstep or eventually succumbed during both both environments.
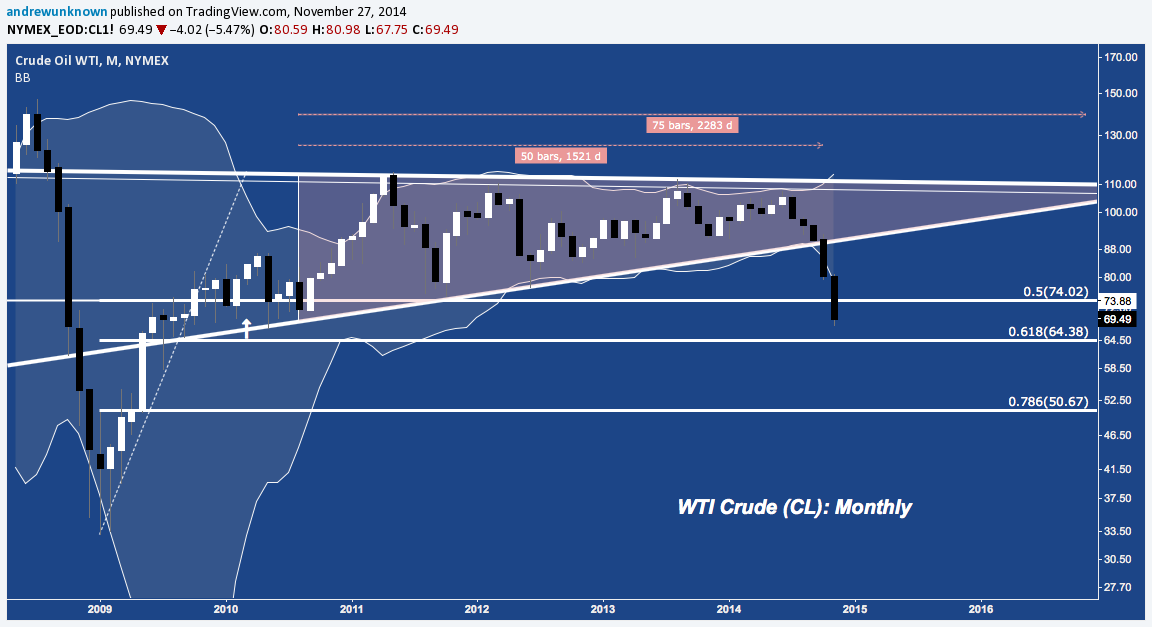
Today’s move is a continuation of October’s breakdown near $90/bbl of Crude’s 3.5-year Ascending Triangle (below), which consolidated both 2008’s crash and 2009-2010’s sharp rebound. The drop today also snaps the 50% fibonacci retracement (at $74.02) of the entire recovery off the late 2008 lows. The next fibonacci retracement level is still roughly 8% lower, at $64.38. The Ascending Triangle pattern’s measured move objective is much lower, in the $40s.
There is some good news from a technical perspective for both oil bulls (::crickets::) and traders looking to enter or add long on CL but are wary (as they should be) of catching a falling knife. Today’s shellacking hit major horizontal support deriving from 2009/2010’s wide congestion band around $66-$72, and tagged the potential reversal zone of a 1.5-year Bullish Butterfly harmonic pattern, of which 2014’s drop has made up the final leg:
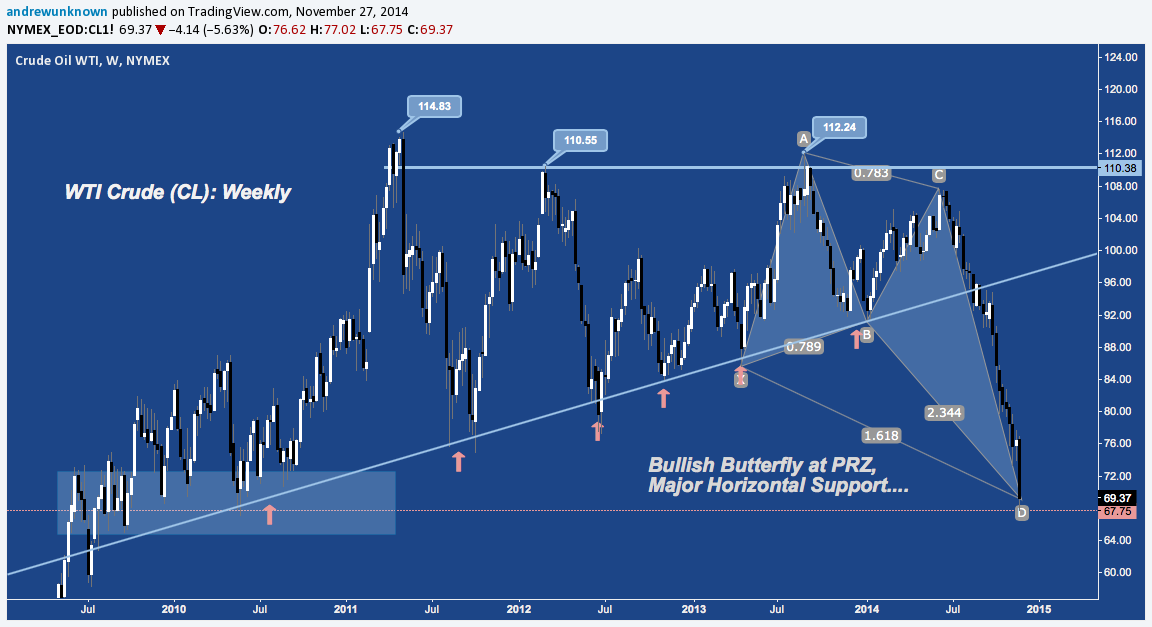
Crude’s volatility and selling pressure doesn’t have to abate here, but this is the strongest locus of demand since $90/bbl and best opportunity longs have to hammer out a base from which Crude might pivot higher.
Interested in more timely analysis on Crude Oil? Here are further charts and analysis from other See It Market contributors who have been on top of Oil this week:
- Gold & Oil: Have the Charts Been Helpful? by Chris Ciovacco (11/25/2014)
- Bottom Fishing In Oil? Sure It’s Possible, And Here’s How by Jonathan Beck (11/23/2014)
Also check out the other posts in this series on Crude that give the play-by-play covering this years top and subsequent decline:
- Trading Journal: Long-Term Insights on Crude Oil’s Slippery Slope by Andrew Kassen (11/06/2014)
- There Will Be Blood: Will Energy or Crude Oil Blink First? by Andrew Kassen (11/03/2014)
- Crude Oil Drilled in Selloff by Andrew Kassen (10/02/2014)
Twitter: @andrewunknown
Kassen holds no exposure to securities/instruments mentioned at the time of publication. Commentary provided above is for educational purposes only and in no way constitutes trading or investment advice.
 Rolling Over At Key Fibonacci Level?")


 Rolling Over At Key Fibonacci Level?")


