Light Sweet Crude Oil (CL) continues to struggle at finding a solid footing beneath $80 as Wednesday’s move up from $76.50 to around $79 after the EIA’s 1000ET report of lower-than-expected inventories has mostly faded throughout early trading Thursday.
Shorter-term, Crude Oil and Energy plowing through a massive disconnect that will inevitably resolve when the instruments re-converge (more on that in Monday’s piece over here).
It seems intuitive in theory that larger price moves would prompt us to “look left” into the past for clues on larger timeframes. In practice, however, the abrupt and decisive directional resolve of moves like the one Crude is exhibiting often send market observers into smaller timeframes to watch for more granular signs of changes in momentum and how price is (or isn’t) firming at project demand levels. This practice is vital; but a kind of myopia results where it isn’t paired with long-term analysis.
Zooming out to the Monthly timeframe provides crucial perspective on where Crude is at. We learn:
- The current sell off (-29.57%) is the second largest since 2008 (2011’s drop lopped off -34.07%) and longest run of consecutive down months (at 5) since the 7 negative months in-a-row in 2008.
- Sell offs measuring 5 months (caveat: November is still quite young) are very uncommon. The last one going at least 5 months was 2008; but in the last 30 years, there have only been four measuring 5 months: (1985-1986, 1990, 1990-1991, and 1998).
- $75-$76 is a highly important support/resistance level. It was major resistance in 2006 before giving way in 2007, bitterly defended in 2010 and was the level that finally arrested 2011’s decline. August 2011’s Low: $75.71; November 2014’s low: $75.84.
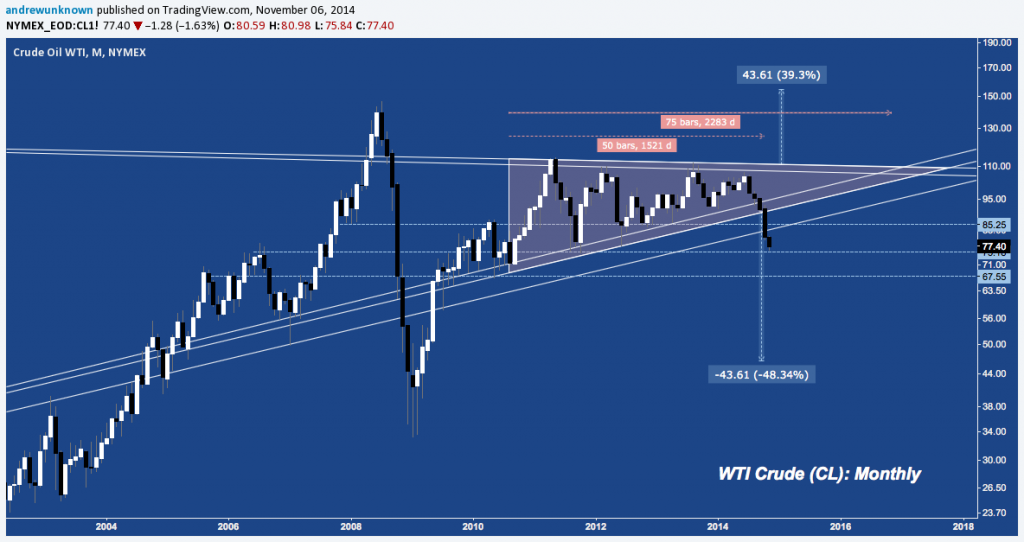
- CL broke down out of a 4-year Ascending Triangle in October and has yet to look back. In fact, it broken down exactly 2/3 (50 months) to its apex, which is optimal for subsequent pattern performance. It’s downside target is much lower, near $45/barrel. Could this happen? It’s tough to imagine. Then again, $76/bbl was tough to imagine back in early July, some $32 higher.
- CL’s rising through-trend line/buffer (rising diagonal white lines below) is broken. Since it was established with the early 2007 low, this line has only broken once: when the world was coming to an end in November 2008. This upward trend trajectory was reclaimed in May 2009 and hasn’t been breached since – until October.
- Below $75, CL’s net major horizontal support level is $68/bbl. That’s about 5% above the 61.8% fibonacci retracement of the 2008-2011 range, but falls right in line with the 161.8% Potential Reversal Zone (PRZ) of a major Bullish Butterfly harmonic pattern (discussed in more detail here):
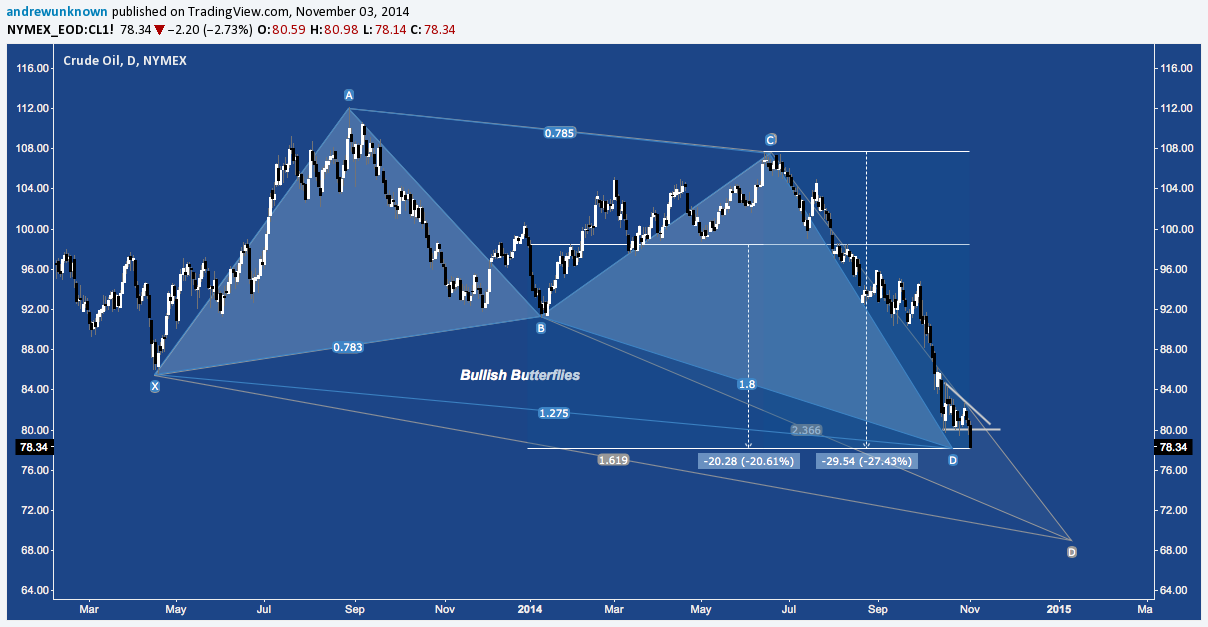
The two major takeaways here are:
- Crude has broken lower from a massive pattern – the pattern that consolidated the entire arc of the 2008 crash and 2009 mean-reverting rip higher. Short-term, the current drop feels unprecedented; but against this broader context, it’s still modest relative to the pattern’s full measured move potential. Overall, the implications of this pattern must be respected first, reminding us to heed that old adage about falling knives.
- Crude is testing (and so far, holding) a major locus of demand at $75-$76. If there’s a level where buyers will step in to arrest the decline ahead of $68, it’s there. It sounds trite, but remaining flexible – whether playing long or short – right here is critical.
Twitter: @andrewunknown
Author holds no exposure to asset classes mentioned at the time of publication. Commentary provided is for educational purposes only and in no way constitutes trading or investment advice. “Slippery Slope” image courtesy of thecommentator.com


: Important Breakout Retest")


