It’s not often that one gets to go bottom fishing as US equities are trading at all-time highs and still in the midst of the strongest bull market in recent memory. But, where there is a bull market in one place, there is likely a bear market in another. And today, that bear market runs along much of the commodity space as one can see in a number of precious metals and energy related commodities. If one believes, as I do, that the longer-term trends still favor lower prices, then is it safer to just shy away from the area all together? Possibly, but given the speed of the recent selloffs, opportunities may appear that one can take advantage of to make a profit. Yes, this may include more risk as trading against the dominant trend is by definition risky, but applying a disciplined risk management strategy will limit that risk and allow for a tactical “gamble” for what could be a sharp oversold rally. With that said, let’s take a look at WTI Crude Oil (WTI – Quote) and draft a hypothetical trading plan.
First a brief technical history. The structural bull market in WTI Crude Oil prices peaked back in July 2008, as a bearish distribution pattern known as a negative outside month pattern warned of some kind of reversal. The brutal selloff was roughly in line with other risky assets at the time, but interestingly, as WTI peaked several months after US equities, it also bottomed about a month earlier (February 2009). For seasoned investors this may not come as a surprise in hindsight as commodities have a tendency to trade in boom and bust cycles. As such, the sharp recovery retraced much of its decline before entering into an extensive period of sideways trading. One should note that the beginning of this sideways trading corresponded with what continues to be a weakening relative strength performance versus the S&P 500.
Over 3 years of consolidation took place in the form of a fairly well defined symmetrical triangle pattern. This pattern was recently resolved in October 2014 to the downside. Now if one can fathom such a thing, this breakdown, renders a potential downside projection into the $40 range. This implies that the 5-month selloff of approximately 31.5% is only halfway over. Remember, these are the bearish projections, but it gives one a directional call to go by until there are sustainable signs to a bottom. So, if this is the case, then why would anyone be interested in putting money to work in WTI Crude Oil? One reason may be that history provides lessons that we can try to profit from, even if we invest against the dominant trend provided one employs a disciplined style of risk management.
WTI Crude Oil Monthly Price Chart
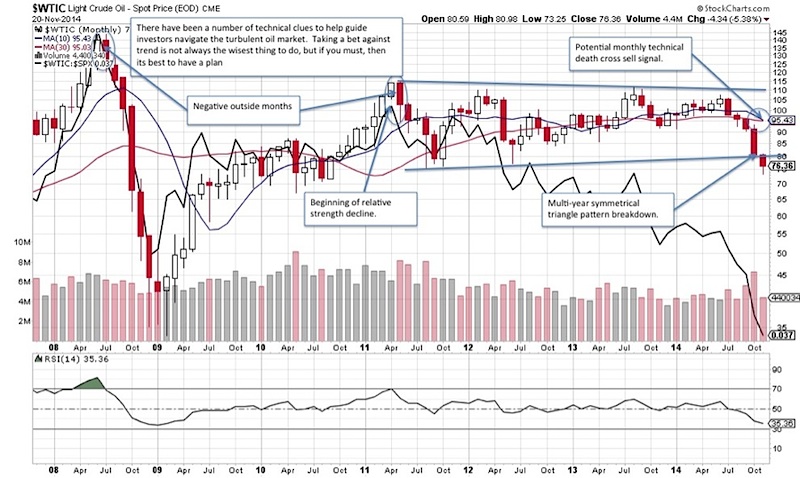
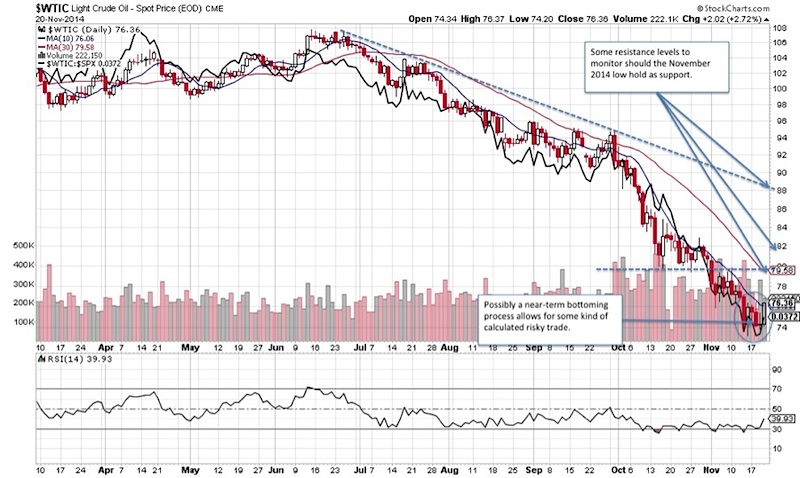
Looking back over the past few years there have been 2 other declines of a similar magnitude for WTI Crude Oil: May 2011 – August 2011 (-34.1%) and March 2012 – June 2012 (-30.0%). Now here is where it gets interesting. The August 2011 bottom (75.71) was followed by a 46% rally, while the June 2012 low witnessed a 45% recovery before peaking in August 2013. Calling bottoms, even temporary ones are very difficult, which is where the risk management comes into play. For example, if you are one that thinks the 11/14/14 low of 73.25 is an important low than this could play as a trigger point to exit a trade should WTI begin to drift lower still, which will limit your downside. Knowing your strategy in advance will also eliminate some headaches and take some emotion out of the trade. On the upside, a 45% rally is no means a guarantee this time around, but should support hold, a move towards 79.50-80 and even into the upper-80s is possible as this corresponds to the June 2014 log downtrend line.
Wti Crude Oil Daily Downtrend Chart – 2014
Right or wrong, at least you’ll have a game plan. Discipline is key to success. Thanks for reading.
Follow Jonathan on Twitter: @jbeckinvest
No position in any of the mentioned securities at the time of publication. Any opinions expressed herein are solely those of the author, and do not in any way represent the views or opinions of any other person or entity.


