 By Andrew Nyquist
A couple weeks back, the financial markets appeared to be on the cusp of a breakout. But follow through was nigh, and the S&P 500 rally broke down.
Well, here we are again. Fiscal cliff deal in the bag, America repaired (insert sarcasm), and we’re off to the races. Truth is, the S&P 500 rally looks promising near term. After the prior failure (mentioned above) came nasty sentiment and pessimism. And this often provides a nice entry for traders and investors, as investors short the market or biased against the market slowly capitulate back into the market. But this is only in theory, and the market will have to show follow-through to validate this move as well.
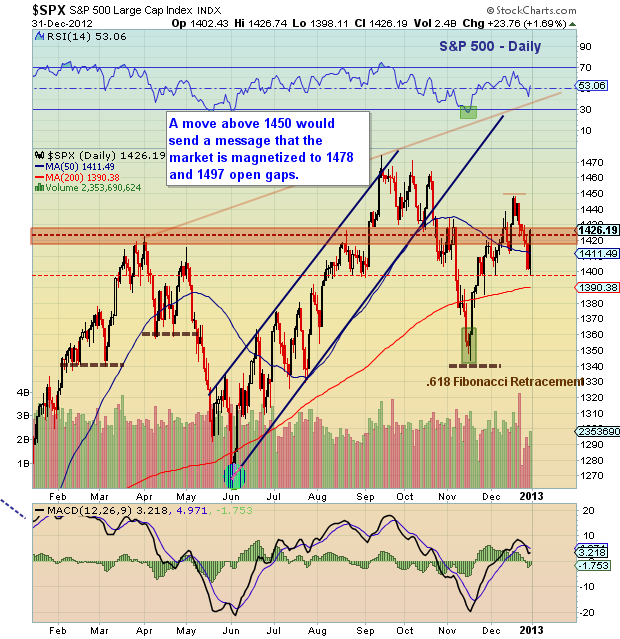
Technically, I’m watching 1450, as this level marks the last lower high. A move through 1450 would tip off investors that the market is ready to move to new highs. Open gaps at 1478 and 1497 are initial magnets. However, I would expect 1450-1460 to provide some congestion and a likely first dip level. This would be buyable with risk defined around Monday’s close (1425ish). On the flip side, should 1450 fail to hold and the S&P 500 fill today’s gap, then all bets are off. We’ll soon know if this S&P 500 rally is real. See chart below.
Trade safe, trade disciplined.
Twitter: @andrewnyquist and @seeitmarket
No position in any of the securities mentioned at the time of publication.


