 By Andrew Nyquist
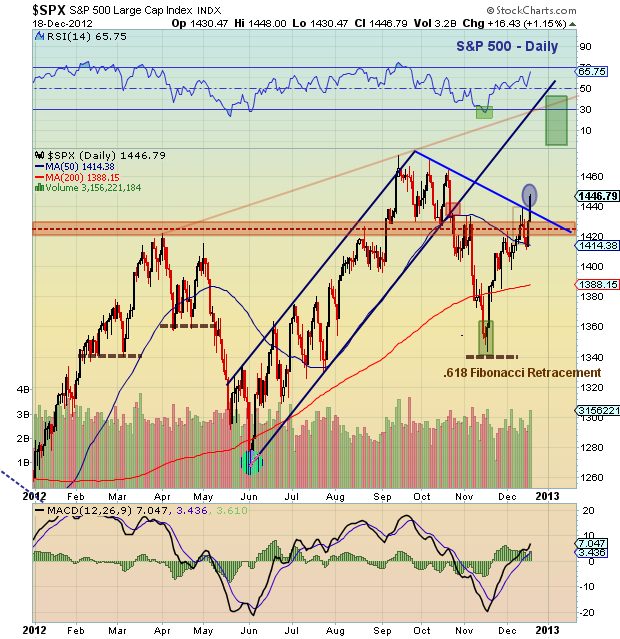
Of the 3 major market indices, the S&P 500 is showing the most strength, breaking out above the downtrend line and closing on the highs yesterday. It will be important to see the index move closer to 1460 before consolidating to give it some breathing room above key support. Monitor 1420 closely. If the S&P 500 pushes through 1460, then the open gap at 1497 would be in play and 1500 plus would be the target.
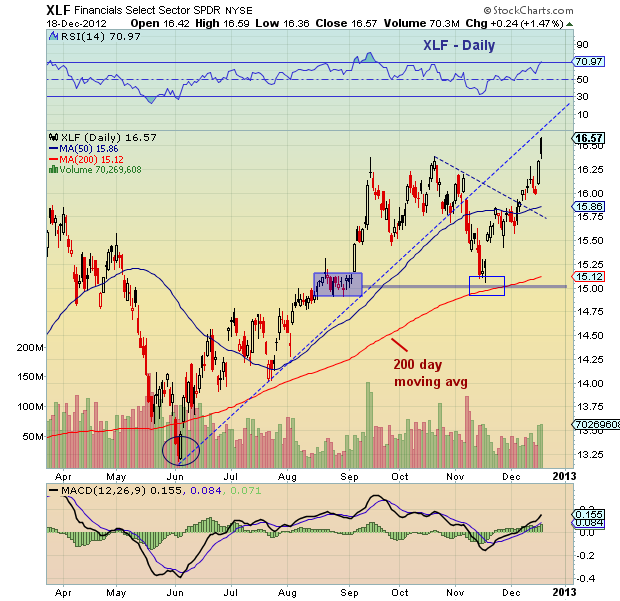
Much of the current strength in the S&P 500 is coming from the Financials Sector (XLF). Cliff of worry, what cliff of worry? Note the Financials went vertical over the past two days, so some sideways action would be healthy. See the charts of the S&P 500 and Financials sector below.
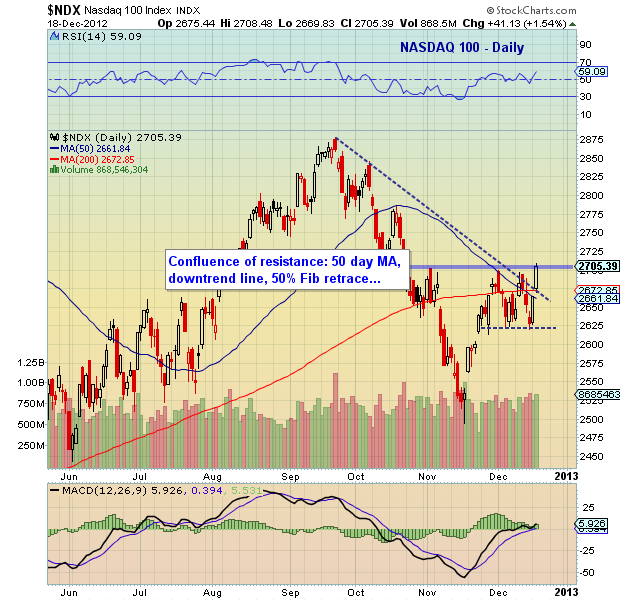
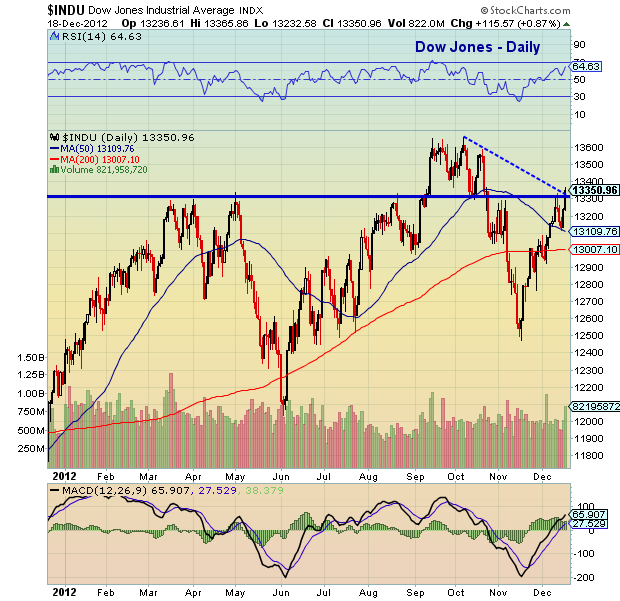
Currently, the Nasdaq 100 and Dow Jones Industrial Average are on the verge of breaking out. Both are right at their respective downtrend lines but showing momentum. This should produce breakouts in these indices over the coming weeks. 2700 is an important toggle on the Nasdaq 100 and 13,350 the equivalent for the Dow Jones. See charts below.
Trade safe, trade disciplined.
Twitter: @andrewnyquist and @seeitmarket Facebook: See It Market
No position in any of the securities mentioned at the time of publication.
Any opinions expressed herein are solely those of the author, and do not in any way represent the views or opinions of his employer or any other person or entity.


