Stock Market Outlook for October 17, 2016 –
S&P 500 futures are now at critical price support regions. These well need to hold if we are to maintain a bullish stance. Otherwise, sellers will still have the upper hand. Note the S&P 500 futures chart below. Price resistance is lodged at 2141-2144, and price support is lower at 2116-2112. In order for the S&P 500 (INDEXSP:.INX) to hold the general range and behave as range bound charts do, we’ll need to watch support hold. The next couple of days will be critical. I expect buyers will come in, but also anticipate that traders may try to play a few games at the edges, so be careful staging trades here. Trading momentum holds bearish for now, but is on the rise.
See today’s economic calendar with a rundown of releases.
TODAY’S RANGE OF MOTION
S&P 500 Futures Trading Chart – October 17
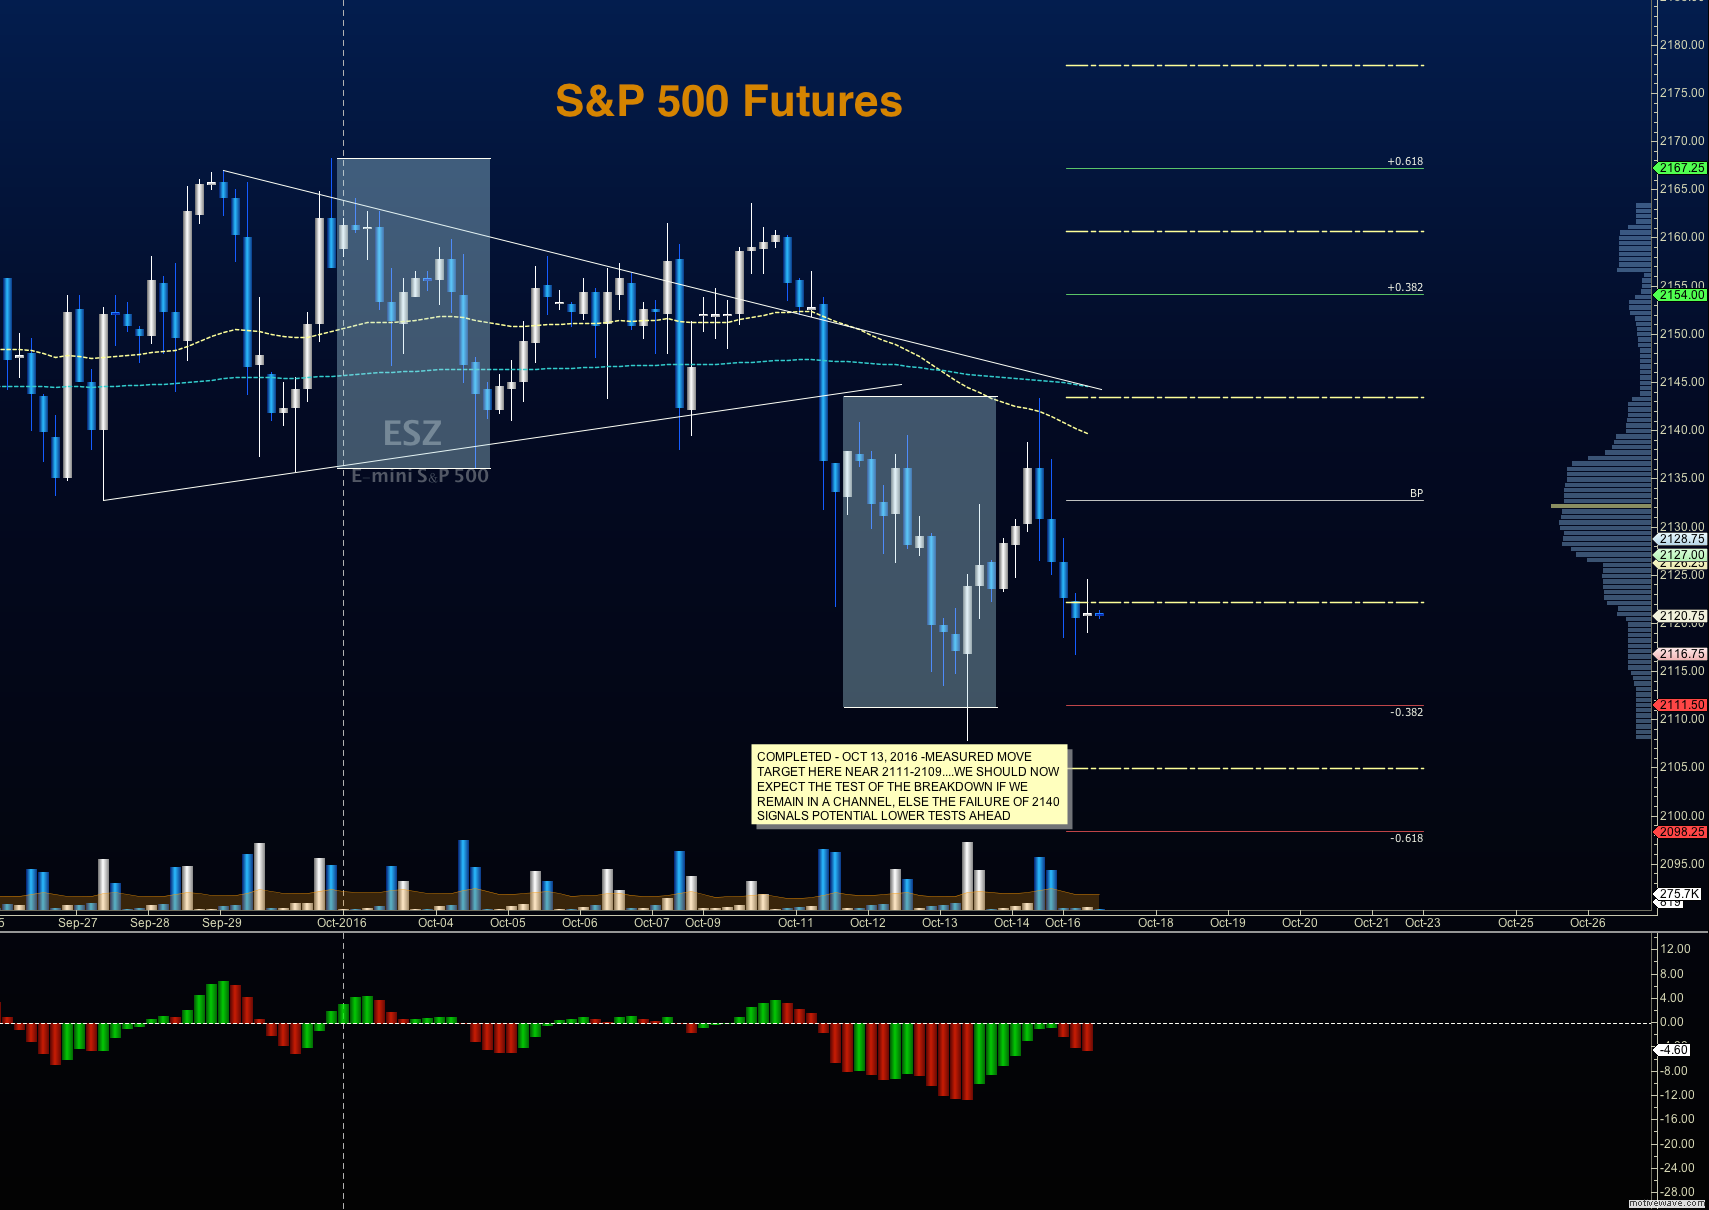
Upside trades on S&P 500 futures – Favorable setups sit on the positive retest of 2122.5, or a positive retest of the bounce off 2118 with upward momentum. I use the 30min to 1hr chart for the breach and retest mechanic. Targets from 2118 are 2123.5, 2126, 2128.5, 2130.5, 2134.25, 2136, 2138, 2140.50, and 2144. As always, additional targets will be in the Members only portion of the morning blog.
Downside trades on S&P 500 futures – Favorable setups sit below the failed retest of 2121, or at the failed retest of 2129 with negative divergence. Retracements into lower levels from 2129 give us the targets of 2126.5, 2123.75, 2121.5, 2119, 2116.75, 2112.75, and 2109.5 Additional targets will be in the Members only portion of the morning blog, and in the live trading room.
Nasdaq Futures
The NQ_F sits in congested regions above 4789 – which holds as relative support. Congestion regions hold the chart range bound, between 4814 and 4818. Resistance sits above there at 4832 – 4841. Momentum is bearish, and support holds lower near 4780-4770.
Upside trades on Nasdaq futures – Favorable setups sit on the positive retest of 4802.25, or a positive retest of 4790 with positive momentum. Bounces are likely to be into resistance for now. I use the 30min to 1hr chart for the breach and retest mechanic. Targets from 4802.25 are 4805.75, 4808.25, 4812.25, 4816.75, 4822, 4824, 4832, 4836.75, 4841.5, and 4846.
Downside trades on Nasdaq futures – Favorable setups sit below the failed retest of 4787 (needs negative momentum here for continuation), or at the failed retest of 4800.5 with negative divergence. Retracements into lower levels from 4800.50 are 4796.75, 4794.5, 4790.5, 4784.75, and 4781 to 4774.
Crude Oil
The WTI chart just bounced off congestion of 50.23. Resistance there was overcome after a battle at 50.2 for almost sixteen hours. Higher resistance levels loom near 50.71 and 51.17. Price action remains orderly – as if the traders are comfortable moving in and out of positions through the range. Support today holds near 49.9 to 49.6.
Trading ranges for crude oil should hold between 49.4 and 51.17 in the current pattern.
Upside trades on crude oil futures can be staged on the positive retest of 50.64, or at a positive retest off 50.12 with positive momentum. I often use the 30min to 1hr chart for the breach and retest mechanic. Targets from 50.12 are 50.33, 50.59, 50.77, 51.06, 51.29, 51.43, and 51.49.
Downside trades on crude oil futures can be staged on the failed retest of 50.87 (watch for higher lows with this test), or at the failed retest of 50.59 with negative divergence. If the price tests above 51.17 in the current space we are likely to breach into higher highs, so use caution shorting at the breach of congestion. Targets from 50.87 are 50.71, 50.62, 50.38, 50.24, 49.94 49.80, 49.68, and 49.57.
Visit TheTradingBook.com for more information.
If you’re interested in the live trading room, it is now primarily stock market futures content, though we do track heavily traded stocks and their likely daily trajectories as well – we begin at 9am with a morning report and likely chart movements along with trade setups for the day.
As long as the trader keeps himself aware of support and resistance levels, risk can be very adequately managed to play in either direction as bottom picking remains a behavior pattern that is developing with value buyers and speculative traders.
Twitter: @AnneMarieTrades
The author trades stock market futures every day and may have a position in mentioned securities at the time of publication. Any opinions expressed herein are solely those of the author, and do not in any way represent the views or opinions of any other person or entity.


 Rolling Over At Key Fibonacci Level?")
