The S&P 500’s upside explosion since February 11th has squeezed the shorts dry, but there’s another squeeze unfolding that’s leading me to believe an even bigger move is on deck for the stock market.
The squeeze I’m referring to lies in the monthly chart of the S&P 500, specifically the total collapse in Bollinger Band width… i.e. when Bollinger Bands squeeze.
What Are Bollinger Bands? And What Is A Bollinger Bands Squeeze?
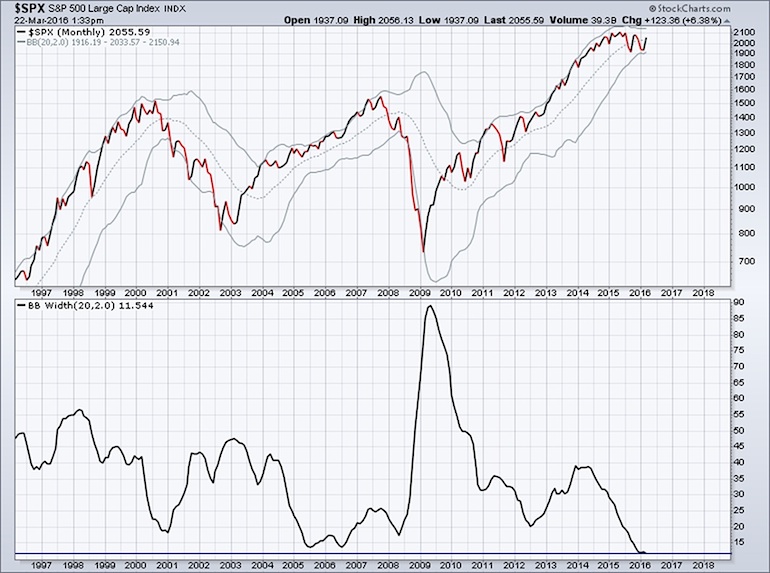
Bollinger Bands are a technical indicator created by John Bollinger designed to help a trader or investor shed some light on the dynamic nature of volatility. According to John’s website, www.bollingerbands.com, the purpose of Bollinger Bands is to “provide a relative definition of high and low. By definition, prices are high at the upper band and low at the lower band”. The standard or default parameters used in calculating Bollinger Bands are 20 periods and two standard deviations. The unique nature of what we can observe today lies in the fact that the monthly closing prices for the S&P 500 over the past 20 months has demonstrated virtually no volatility. The highest monthly close over the last 20 months is 2,107.39, which is our all-time high monthly close from May of 2015, and the lowest monthly close over the same time period is 1,920.03 from September of 2015. The high-low range is just 8.89%, which is the result of the trendless churning the S&P 500’s experienced the past 20 months. While there’s been sparks of intense daily and weekly volatility, it hasn’t revealed itself on the monthly chart. This has led to an extreme tightening in the spread between the upper and lower Bollinger Bands. (The width between the bands is illustrated on the bottom half of the chart)
So what does a Bollinger Bands squeeze mean for the stock market?
John refers to this tightening condition as “the squeeze” and since it’s the result of a period of low volatility for the S&P 500, “the squeeze” tends to precede a period of high volatility for the S&P 500. In plain English, when the S&P 500 idles in “neutral” for an extended period of time, it often finds itself doing 100mph in either “drive” or “reverse” shortly thereafter.
As of this writing, the width between the upper and lower Bollinger Bands sits at just 11.53%. Keep in mind the average Bollinger Band width since 1970 is 33.23%, or 188.2% greater than our current reading.
That’s a Bollinger Bands squeeze if I’ve ever seen one. Should the width between the bands close the month of March at 11.53%, this will be the lowest monthly close since March of 1995, or exactly 21 years ago, and just prior to one of the greatest bull runs the S&P 500’s ever experienced. In fact, since 1970, I identified just 14 calendar months where the Bollinger Band width closed the month below 12.
Interestingly, the average and median forward 6 and 12 month returns for the S&P 500 following a calendar month where Bollinger Band width closed below 12% are downright massive. Forward looking 12 month returns for the S&P 500 from month end signal date have never been negative.
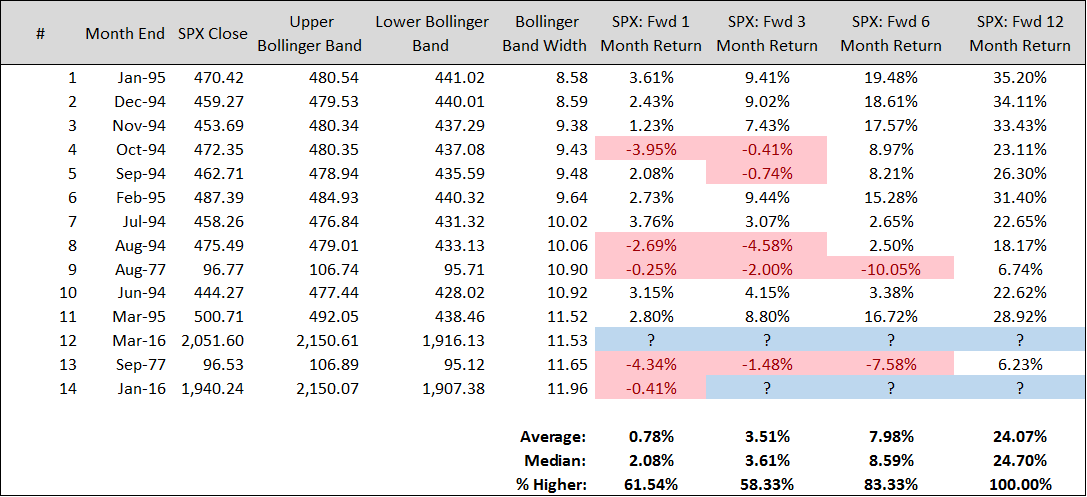
Now, before you go and leverage long the S&P 500 in your IRA’s, it’s important for you to keep perspective regarding two critical areas. First, 14 calendar months’ worth of occurrences means very little, if anything, and second, “the squeeze” offers no directional bias! It is prudent to leverage deeper analysis in order to forecast the directional breakout.
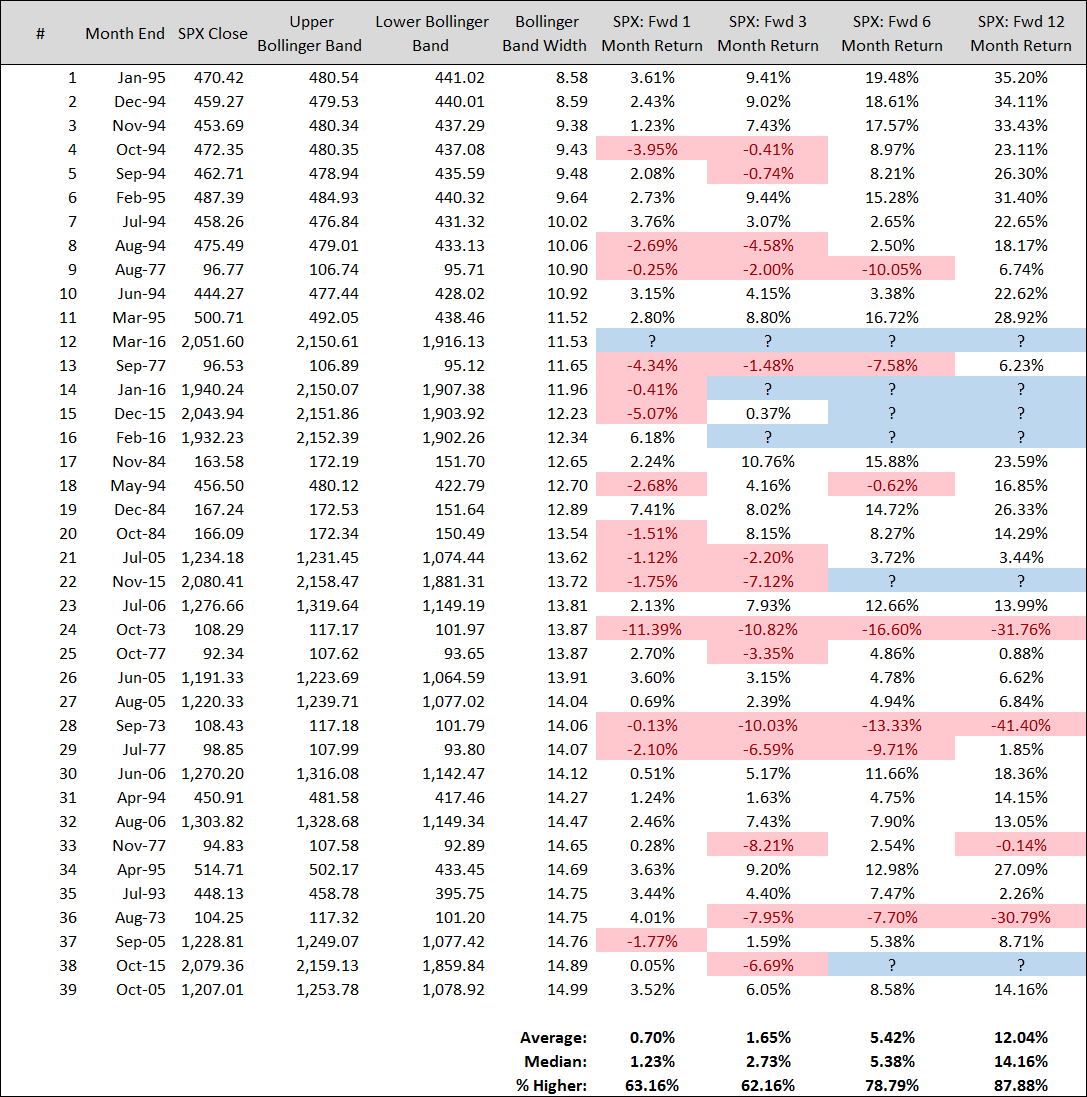
Therefore, if we alter the Bollinger Band width threshold to identify all calendar months since 1970 where the width closed less than 15% we can increase our sample size to 39. While this is still an insignificant sample size, it’s relevant because we can then incorporate 1973, or a scenario where a Bollinger Bands squeeze (aka “the squeeze) wasn’t a good time to buy stocks, but instead preceded a massive move lower for the S&P 500. Bollinger Band width closed August through October of 1973 at 14.75%, 14.06%, and 13.87% respectively. The index would go on to plunge through the lower Bollinger Band and decline -41.40% from the end of September 73 to the end of September 74. Ouch.
continue reading on the next page →
")


")
