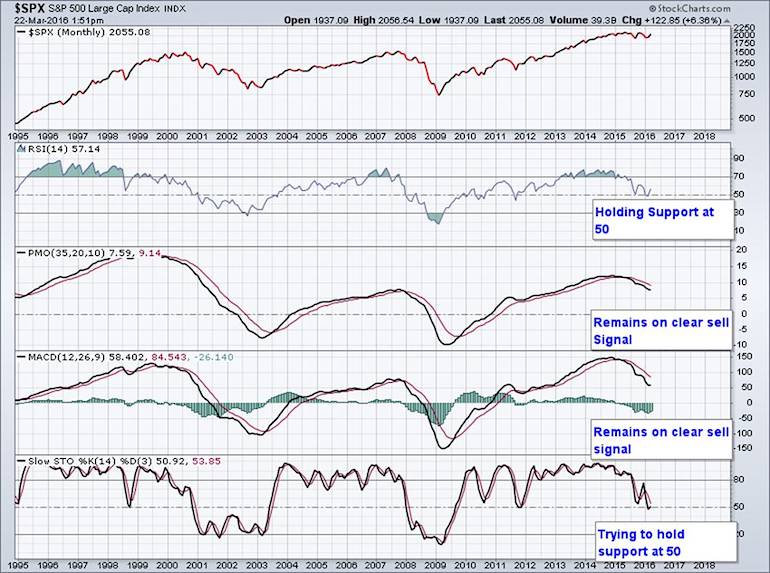
If we incorporate momentum oscillators we can attempt to identify additional confirmation in forecasting the breakout.
However, oscillators on the monthly chart of the S&P 500 provide little clarity as of today: The Relative Strength Index (RSI) offers optimism as it appears to have found support at and around the 50 level, while the Price Momentum Oscillator (PMO), a favorite of mine that I picked up from the work of technician Carl Swenlin, offers rather extreme pessimism. If we add the MACD and Slow Stochastics as the tiebreakers, MACD’s siding with the PMO, suggesting the path of least resistance is to the downside, while Slow Stochastics is trying to reverse course at and around the critical 50 level.
Therefore, we also must be conscious of the head fake, or the scenario where price appears to breakout in one direction, only to then completely reverse course. This should be front and center for every trader or investor as the last two years have been nothing but head fakes. It’s reasonable to speculate whether the strength since February will be remembered as one giant “suckers rally”. Alternatively, the contrarian view is the selloff in January and February was the false move, and the stock market is actually headed much, much higher. Few participants seem to believe a massive upside breakout for stocks is in the deck of cards.
Bottom-line – a bollinger bands squeeze (aka “the squeeze”) suggests something massive is brewing for the S&P 500. While nobody alive has any idea when or what direction the breakout will occur, it’s imperative both traders and investors have a game plan to be on the right side of the trade before the breakout occurs. You don’t need to predict the breakout, but you do need to be prepared to identify it shortly after its arrival.
While there is nothing predictive about something like a 12 month moving average, using it as a bull-bear divide with maniacal robotic like discipline can ensure you’re on the right side of the next massive move, a move I envision being a consistent and persistent trend in one direction – as if you’re driving 100mph in “drive” or “reverse”.
Thanks for reading.
Further reading from Steve: “S&P 500 Reversal Helps Define Trendless Trading Range“
Twitter: @SJD10304
The author may hold positions in related securities at the time of publication. Any opinions expressed herein are solely those of the author, and do not in any way represent the views or opinions of any other person or entity.

 and Russell 2000 (IWM)")


 and Russell 2000 (IWM)")
