As most active investors are aware, the S&P 500 (INDEXSP:.INX) has traded in a tight range over the past several weeks. Recently, stocks have touched the lower part of that range, testing the late summer breakout.
But there are a couple of interesting developments that are worth monitoring for both short-term traders and longer-term active investors; a key test for the former, and an S&P 500 bearish divergence for the latter.
These observations show up on two different time intervals/charts.
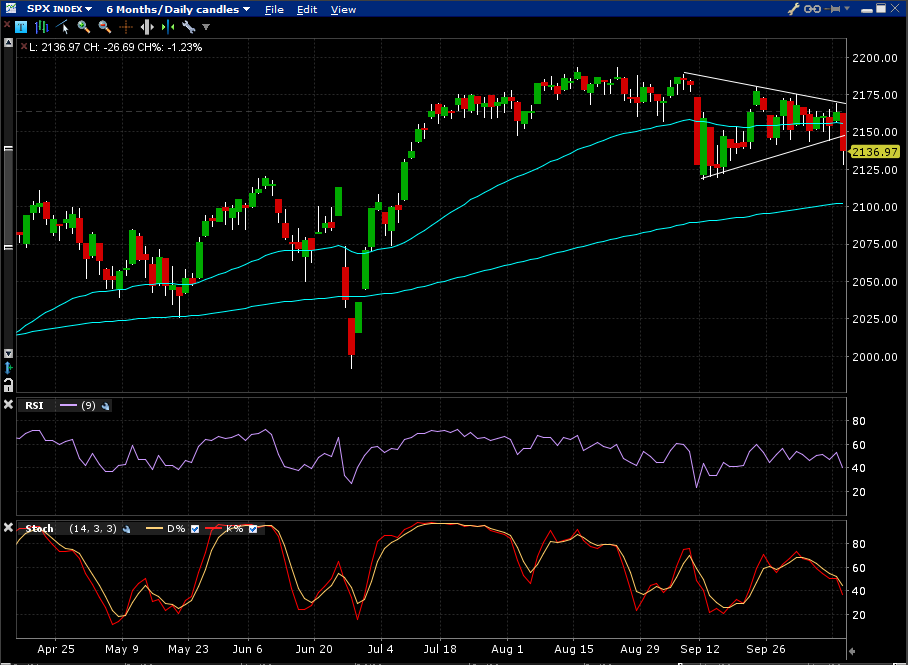
S&P 500 “Daily” Chart
The first chart I’ll focus on is the daily bar chart for the S&P 500. As you can see, a wedge formation has broken to the downside. This is concerning near-term, especially if momentum were able to build. The first line of price support is at 2120, which is followed by deeper support at 2100.
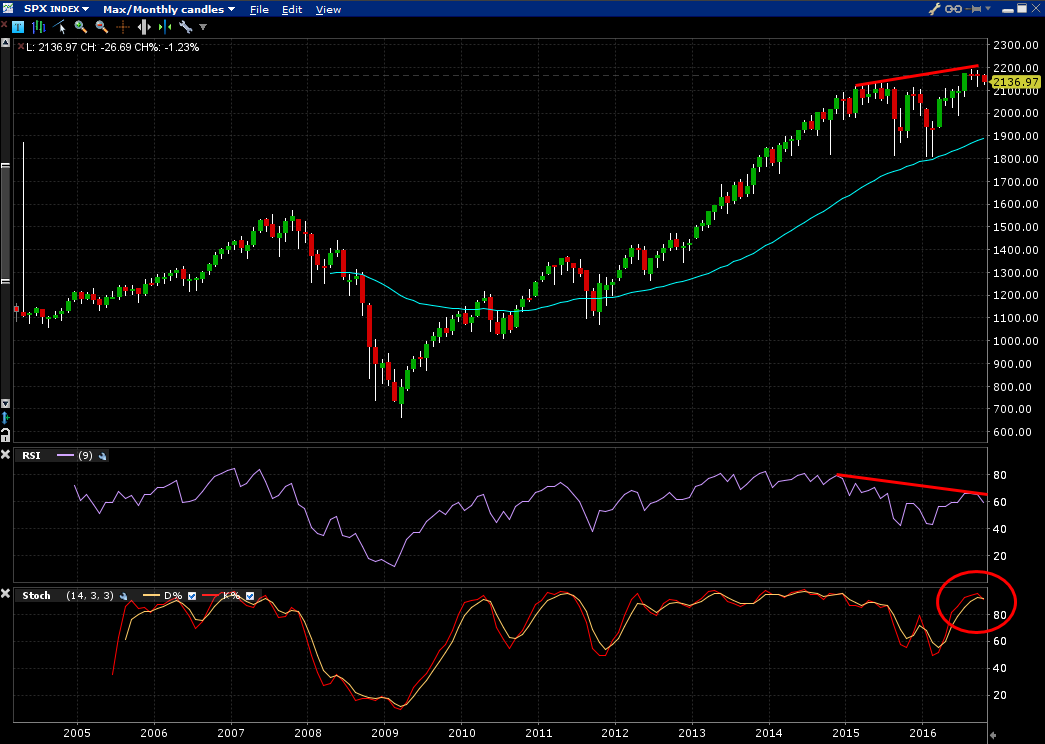
S&P 500 “Monthly” Chart
If the S&P 500 can hold above key price support levels, it can rally once more. But one nagging concern lies within a longer-term time frame. On the “monthly” bar chart, a negative RSI divergence has developed. Since this is a monthly chart, the S&P 500 bearish divergence could go on for a while yet. However, it is worth noting that Stochastics are overbought and potentially rolling over.
More from Gavin: Gold: Expect An Uptick In Trading Volatility
Thanks for reading and trade safe.
Twitter: @OptiontradinIQ
Any opinions expressed herein are solely those of the author, and do not in any way represent the views or opinions of any other person or entity.


