Gold has been pummelled in the last few days and things don’t look like easing up any time soon. Taking a look at the chart of the SPDR Gold Shares (NYSEARCA:GLD), let’s see if we can see where the this Gold ETF might find some support.
Gold ETF (GLD) Technicals
First off, the 200 day moving average is just below the current price at 119.76. However, the two areas that interest me more are the open gap between 116 and 117.5 and also the primary price support level at 115.
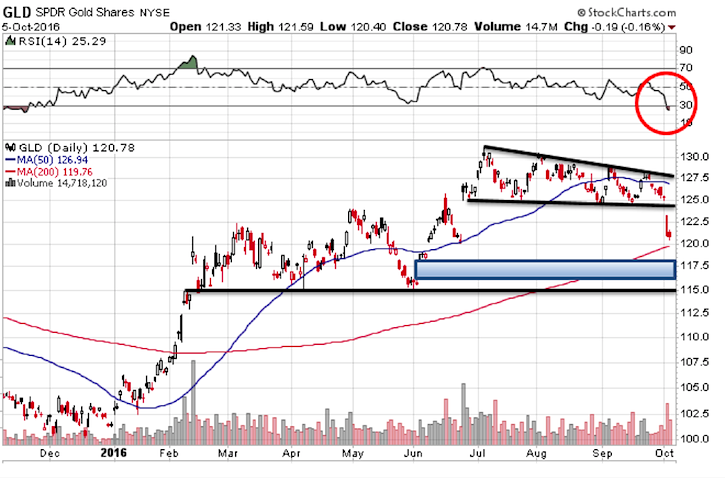
Hopefully GLD gets down to those levels, because if it does, I think it might be worth a small nibble on the long side.
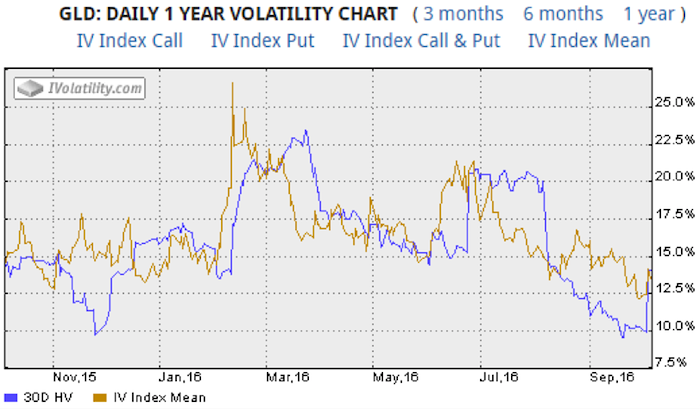
Surprisingly, gold implied volatility has not jumped much at all during the recent sell off. Implied volatility has only rising from 12.5% to around 14%. That seems really odd to me given the magnitude of the selling. The story of gold dropping has been all over the major newswires. Here’s a look at gold implied volatility (via GLD).
So what gives?
To me, the lack of volatility signals that maybe the selling isn’t done with yet. We haven’t see anything like a panic yet.
I’m currently playing GLD via a gamma scalp, so I’m hoping for plenty more movement in the stock and lots more volatility in gold prices.
Will be interesting to see how this plays out.
Twitter: @OptiontradinIQ
Any opinions expressed herein are solely those of the author, and do not in any way represent the views or opinions of any other person or entity.


: Showing Some Signs of Emerging Strength")
