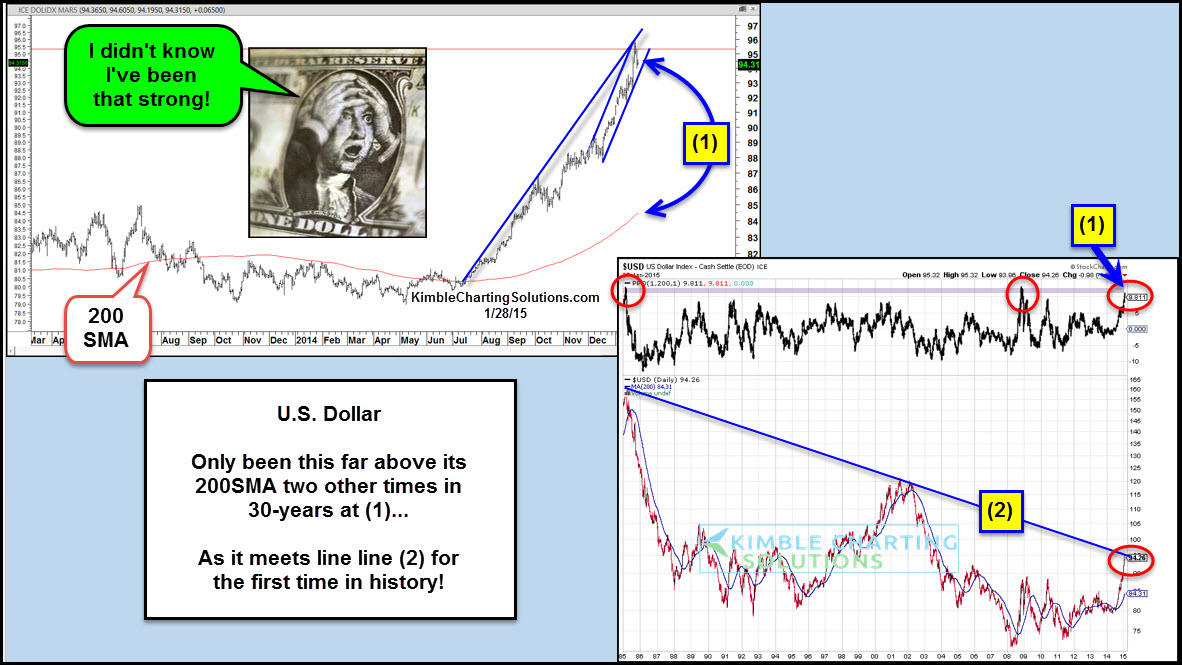
The US Dollar Index turned vertical into 2015, touching as high as 95.86 over the past week. But the recent rise has also pushed the US Dollar Index to one of the highest levels above its 200 day simple moving average in the past 30 years. This is truly rare territory for the US Dollar.
Can anything cool it off?
Well, it just so happens that this unheard of strength has propelled the Dollar into a major resistance level: it’s 30 year downtrend line. Will the fact that it is overbought and overstretched, and butting up against potential resistance, slow the Dollar down?
US Dollar Index Charts (Near-Term & 30 Year Views)
I shared a post on the Dollar just 2 weeks ago, asking, “Is The US Dollar Ready To Change The Financial Landscape?“. This is a major question that active investors will have to contend with in 2015, all the while watching this key resistance line.
Regardless of the distance above its 200ma, should the US Dollar break above this cluster of resistance, it would be deemed a breakout and the assets that have been weak, due to the strong dollar, would just get weaker.
We are in important times! Thanks for reading.
Follow Chris on Twitter: @KimbleCharting
No positions in any mentioned securities at the time of publication. Any opinions expressed herein are solely those of the author, and do not in any way represent the views or opinions of any other person or entity.
: Cup (and Maybe Handle) Watch")
 Trading Near Top Of Price Range")
 Reaches Important Price Support")