S&P 500 Breakout? Stats, Market Concerns, And Forward Returns
It was June 30th 2016, and the S&P 500 finished the month at a value of 2,098.86, less than 10 points away from an all-time high monthly close. Fresh off the heels of the Brexit panic, the index had screamed higher by more than 100 handles the final three trading days of the month. The 200 day moving average was your typical bull market trampoline, upward momentum was real, and just six trading days later on July 11th the S&P 500 would establish a new all-time high. The stock market was hot.
Buyers were eager, sellers were scarce, prices were rising, and bad news was good news. A popular narrative was that Brexit created such uncertainty that it may spring a beautiful marriage between monetary and fiscal policy from the largest of Central Banks and Governments around the world. The S&P 500 finished July at 2,173.60, a new all-time high monthly close. Finally, the S&P 500 was out of “neutral” and back in “drive” revving its engine.
This S&P 500 breakout was upon us, global equities were off to the races.
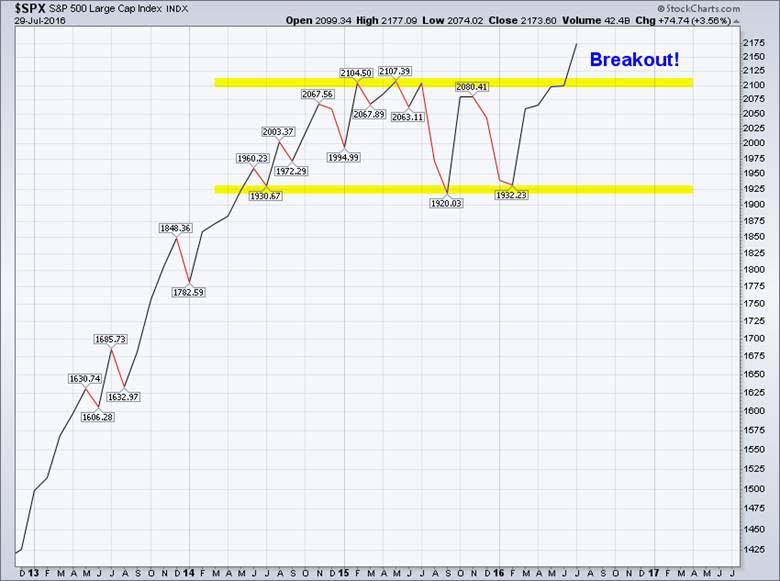
Except it appears today that the breakout may be nothing but a false start, a broken breakout. Recent price action is like sitting in traffic and finding an open lane to your left. You make the lane change, step on the gas….only to then slam on the brakes.
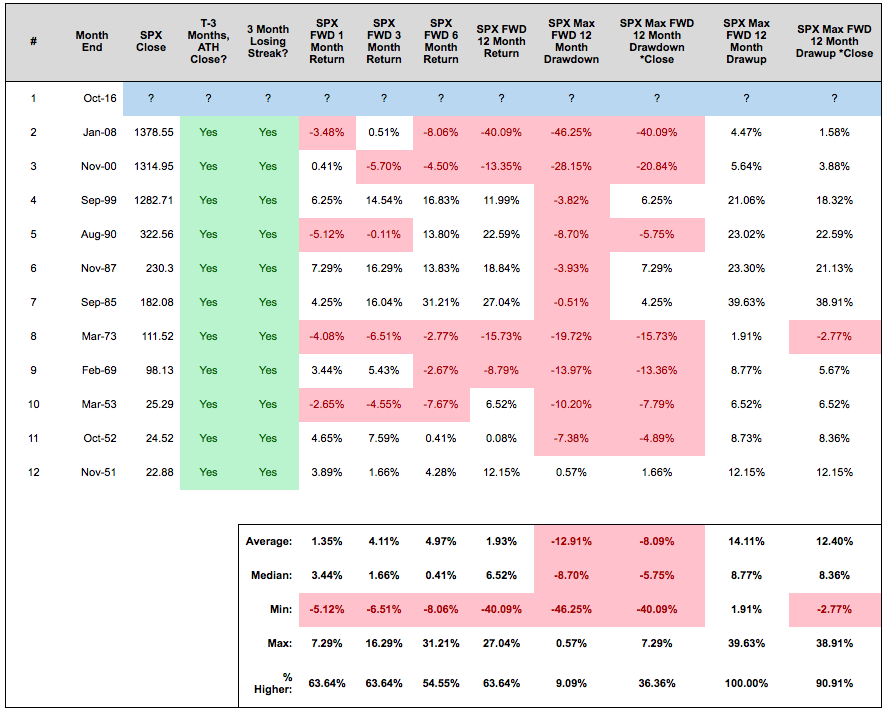
Since July’s close, the S&P 500 hasn’t resumed its primary uptrend, but rather it’s been stuck in the mud, dead in its tracks. The index closed lower in both August and September, and just this week the major stock market index traded down to 2,114.72, a lower low than the month of September. This is important as a calendar month that trades below the low of the prior month finishes in the red 69% of the time dating back to 1970 (213 out of 308 calendar months). With September’s low being 2,119.12, this means history would suggest there’s only a 31% October finishes in the green. Those aren’t great odds unless you’re standing at the plate in a game of baseball. This leaves us with the prospects of a three month losing streak immediately following an all-time high monthly close. Since 1950, there’s been 195 calendar months that finished at an all-time high and only 11 of them were immediately followed by three month losing streaks. While this setup isn’t overly bearish as a whole, I’d be remiss in not pointing out that this was how each of our last two Bear Market’s began…
On the flip side, because there’s always a flipside when forecasting markets without the presence of a crystal ball, the Bears are yet to inflict any damage in the price of the S&P 500! If October was to have closed today, the total price decline for this three month losing streak would be -1.89%. There’s been 62 three month losing streaks since 1950, and only three of them saw the S&P 500’s price decline by less than -3% from start to finish. An October close above 2,108.39, but below 2,168.27, would mark the fourth.
Also read: 5 Reasons Stocks May See More Downside In October
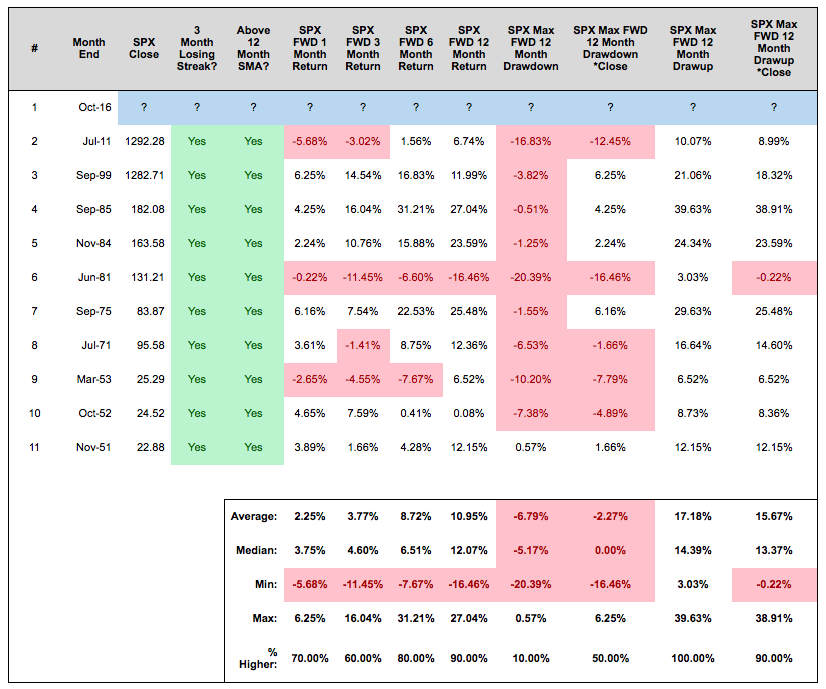
We also have to consider that virtually all trend following systems or methodologies label the primary trend for the S&P 500 as up. Therefore, if we identify all three month losing streaks where the S&P 500 closed above its 12 month simple moving average (12MA) as of the third month’s close, the picture turns decidedly bullish. This has occurred 10 times dating back to 1950, and the S&P 500’s forward 12 month returns are higher nine of ten instances. Additionally, 50% of the time the S&P 500’s monthly close at the end of the three month losing streak marks the lowest monthly close for the S&P 500 over the forward 12 months. An October close above 2,080.29, but below 2,168.27, would mark the eleventh sample.
So we have the possibility of an all-time high monthly close followed by a three month losing streak reminding us of 2000 and 2008, and a possibility of a gentle three month losing streak during a primary uptrend which suggests “buy the dip”. Conflicting information, which makes sense since contrary to popular opinion, the S&P 500 hasn’t broken out…and it hasn’t broken down.
The major stock market index is still stuck in neutral, doing a whole lot of nothing. The S&P 500 reached an all-time high in the fourth quarter of 2014 at a value of 2,093.55. Here we are, nearly two full years later, and the indexes price only return is higher by a whopping 1.88%. The S&P 500 hasn’t given Bulls the follow through you’d generally expect after a supposed two year breakout to fresh all-time highs, and it hasn’t broken down to feed the Bears evidence of increased selling pressure into higher prices. Over confidence in your convictions is a killer in a dynamic and ever changing marketplace, and too often traders and investors fail to simply say “I don’t know”. From my lenses, the S&P 500 is still in a state of “prove it”, that is the index will need to show me sustained price action in either direction for me to glean an element of directional certainty. My advice is you ask the index to show you the same. Until the S&P 500 proves it, don’t be afraid to say “I don’t know”, because all we know at this point is the S&P 500 hasn’t broken out, or broken down….yet.
Thanks for reading.
Twitter: @SJD10304
The author may have a position in mentioned securities at the time of publication. Any opinions expressed herein are solely those of the author, and do not in any way represent the views or opinions of any other person or entity.


