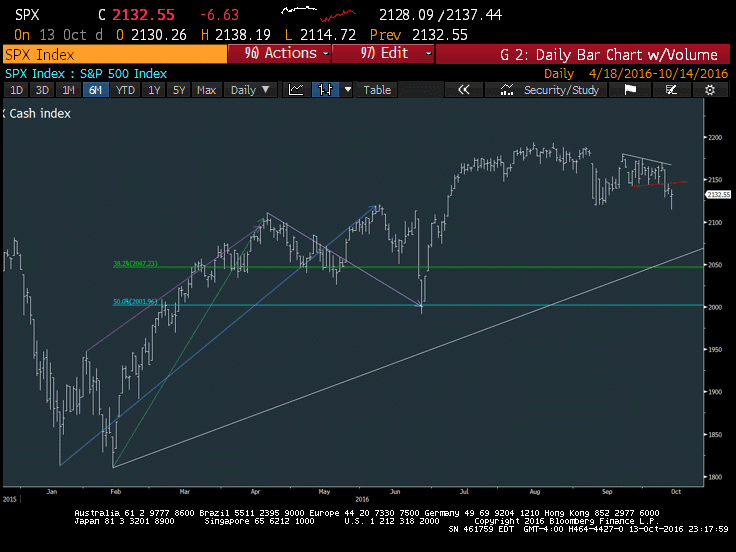
U.S. Equity Markets enjoyed a nice reversal to the upside, but that came along with some technical damage to the charts (and beneath the surface).
Stock prices initially got down below the September lows on the S&P 500 (INDEXSP:.INX), while holding up on the futures. This provided some early evidence that this area would prove to be important support in the near-term. But the weight of the evidence is skewed slightly bearish over the very near-term.
For Friday and heading into next week, I expect a pullback to test Thursday’s lows and lower. So until/unless prices get above 2150, it should be right to sell into strength.
Technical Market Thoughts
The following suggest it remains premature to take on too much of a bullish stance just yet.
1) New lows continue to expand. NYSE lows have hit the highest levels since mid-September.
2) Fewer and fewer stocks are participating in this advance. Market breadth started to wane when stocks began moving sideways over the last few weeks. This wasn’t overly problematic, however the breakdown of support for the S&P 500 on Tuesday was in fact negative. Coinciding with that break to new lows, we saw selling in sectors like healthcare and materials, while technology and energy both reversed meaningfully at Tuesday’s close.
3) Structurally we’ve seen breakdowns in key sectors. Though the uptrends from February are very much intact, this has caused momentum to rollover.
4) Sentiment remains subdued. However, it is in no way at capitulatory type levels after the weakness we’ve seen. A huge amount of volume occurred into declining vs advancing stocks at the highs, causing nearly a 90% down day on 10/11. this was similar to what happened in late December prior to a selloff. When these types of readings happen at highs they tend to be far more bearish than bullish
5) Defensive stocks have begun to stabilize. In fact, many have turned higher or begun to outperform in recent days. REITS, Utilities, Staples and Telecomm all outperformed in recent days. This is the classic sign of a risk-off market, as most of these stocks have been pummeled in the last couple months and remain well off 52-week highs.
The Bottom line: What’s interesting when looking at the S&P 500 is that a 38.2% Fibonacci retracement in both price and time arrives at 10/25. That date also marks the convergence of a few other cycles. If prices pullback and retrace 38.2% in price terms into late October, that would line up perfectly for price-time confluence. Measuring and extending the first move down from mid August (on Aug 15 down to sept 12) and extending it, we see 2046 as a perfect 100% extension.

Thanks for reading.
Get more trading insights and market analysis over on my blog Newton Advisor. Thanks for reading.
Twitter: @MarkNewtonCMT
Any opinions expressed herein are solely those of the author, and do not in any way represent the views or opinions of any other person or entity.


