With the US Dollar Index ready for another modest corrective swing downward, this is the time to look for bullish trade entries with precious metals and with certain commodities. For example, during the next few weeks it would be reasonable to shop for a buying opportunity with the iShares Silver ETF (symbol SLV).
Although Silver prices may have more downside in the days ahead, a near-term Silver bottom looks imminent and the Silver ETF may offer a nice risk-reward opportunity (with a stop).
Both the technical pattern and our bigger-picture economic outlook appear to be supportive to Silver prices into 2016.
This is not to say we think silver prices are going to rocket “to the moon.” For at least the next year and possibly longer, we expect precious metals to trade within a range, probably not reaching much higher than their 2013 lows. The weekly chart for the Silver ETF (SLV) shows how we think the first part of a bounce might play out between now and the middle of 2016.
The Silver ETF price has traced a declining, converging pattern since early 2014 which counts well as an Elliott wave ending diagonal – a terminal pattern. Silver prices are also not far from two Fibonacci support areas, with the upper one near 12.74-12.90, and the lower one around 12.17. Since a diagonal pattern should have five moves, each composed of three smaller waves, we expect the fifth and final move on SLV to reach to the vicinity of the lower trend line and/or the areas near the Fibonacci supports.
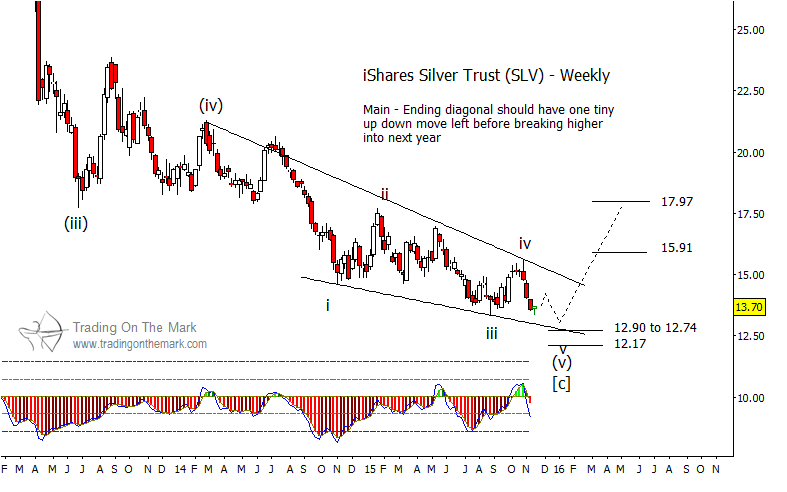
For traders who are willing to accept moderate risk, that confluence of pattern completion and support areas suggests an entry strategy of watching for the Silver ETF to make a higher low after testing the general region. An alternative strategy with less risk would be to wait for SLV to produce a weekly close above the upper trend line of the diagonal, and then to watch for a pullback upon which to enter.
On the weekly chart, we have used Gann techniques to estimate resistance targets at 15.91 and 17.97. Depending on how good a trader’s entry was, those areas might represent opportunities to take profits after a bounce has begun. The lower one also could provide the resistance that would lead to a pullback as described in the preceding paragraph. We will be able to refine the resistance targets after it is clear that Silver prices have put in a near-term bottom.
If the Silver ETF (SLV) stays within a range in 2016 and beyond, there should be several more trades available in both directions. Let us keep you up-to-date in precious metals and other markets with our free newsletter.
Further reading from Trading On The Mark: “Is A Crude Oil Bottom In Sight?“
Twitter: @TradingOnMark
No position in any of the mentioned securities at the time of publication. Any opinions expressed herein are solely those of the author, and do not in any way represent the views or opinions of any other person or entity.

: Showing Some Signs of Emerging Strength")
