Natural Gas Technical Analysis
Natural Gas prices continue to rally following a bullish momentum divergence at the March low, though price seems to be finding some resistance at the psychological $2 mark.
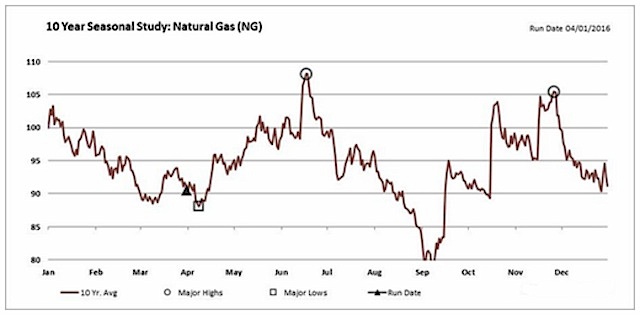
Turning to April, NG has finished positive in 8 of the past 10 Aprils, with an average gain of 3.5%. The first chart below is from Signal Trading Group (@SignalTG). Signal has great seasonality charts, which can be particularly useful when looking for trends in NG. The Signal chart aggregates the trailing 120 months of Natural Gas prices into 1 annualized view with a baseline of 100 on January 1.
Early April has been a great long entry point on the 10-year seasonal chart. NG has tended to rally right until the summer solstice in mid-late June. It may seem counter-intuitive, but Natural Gas prices tends to be weak during the high demand summer and winter months, and strong during many of the lower demand months.
Natural Gas Seasonality (Signal): NG tends to rally from early April through the end of spring.
In the second chart below, you can see how natural gas prices made a lower low while the Relative Strength Index (RSI) made a higher low. This divergence was a good market “tell” that a rally might unfold. That said, any rally may be limited as NG is still operating within the confines of a downtrend.

Thanks for reading!
Twitter: @MikeZaccardi
No position in any of the mentioned securities at the time of publication. Any opinions expressed herein are solely those of the author, and do not in any way represent the views or opinions of any other person or entity.


 Trading at 23-Month Moving Average")
