 The melt-up of the last two weeks has carried most indices from steeply oversold to overbought on their daily timeframes at a rate denoting a level of volatility equities haven’t seen in 3 years.
Many onlookers have been skeptical of this rally given the combination of its short duration and expansive range. Catalysts are seemingly many, including monetary policy tailwinds (speculation about QE4, the BoJ’s QQE bombshell), the usual positive earnings surprises, and a brutal short covering dynamic as both pessimistic bets carried over from early October and incredulous top calls all the way up have been caught in a forced unwind. The net result: S&P 500 (SPX) installed a record close Friday, leaving more than a hint of bearish capitulation in the air.
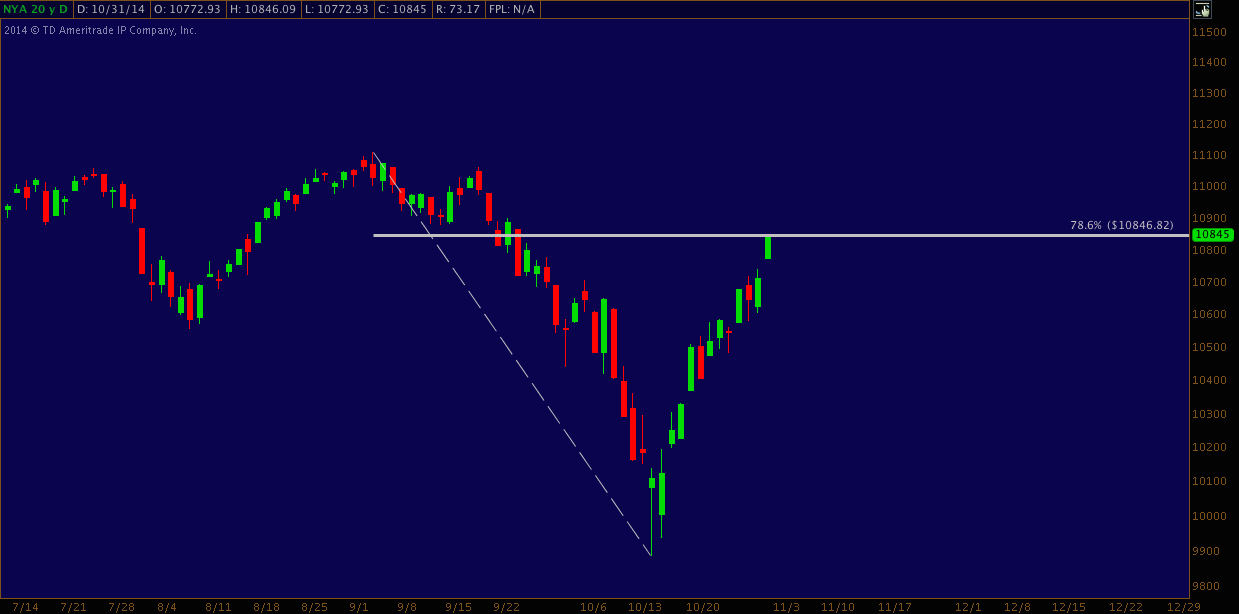
But most other broad US equity indices didn’t fare as well at overcoming this technical milestone – interestingly, including the SPDR S&P 500 ETF (SPY). Another example is the NYSE Composite (NYA), an unusual animal among its peers, comprised of roughly 2000 issues and a contingent of foreign exposure in its upper cap-weighted ranks. NYA finished Friday just beneath the 78.6% fibonacci retracement of its 09/04/2014 all-time high at 11108.39:
The much-followed McClellan Oscillator (NYMO) is optimally suited for analyzing technical cliffhangers like this. NYMO is a versatile indicator well-worth study and addition to any technician’s toolkit. One of the McClellan Oscillator’s simplest applications (like any bounded oscillator, e.g. RSI, Stochastics, etc.) is to evaluate what happens once it tags an extreme. On Friday, the NYMO finished at 86.8, it’s highest reading since 09/18/2013 and just it’s third time finishing above 80 (noted below) in almost 2.5 years:
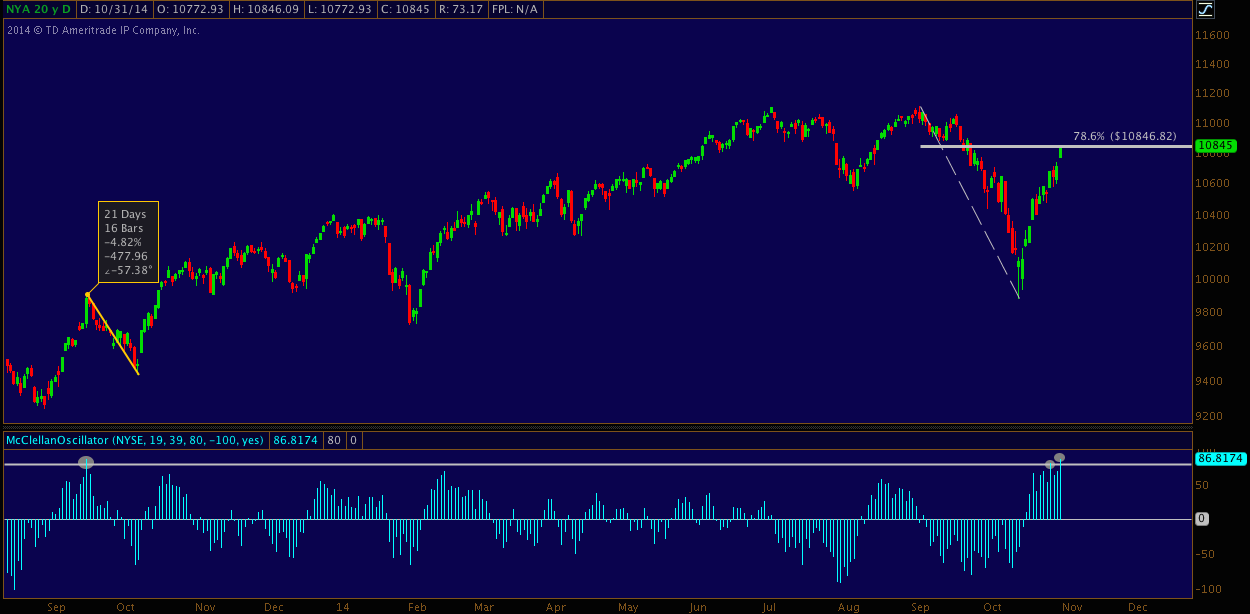
NYSE Composite began to pullback the following day, ultimately installing a 3-week, -4.8% drop before V-bottoming onward and upward.
If only it were that easy every time, right? A NYMO above 80 is often – but, crucially, not always – indicative of an imminent bearish turn for the NYSE Composite and US equities more broadly. But if that reading – rare as it is – isn’t quite consistent enough to provide an edge: what about two McClellan Oscillator readings above 80 in close proximity?
Along with Friday’s 86.8 reading, Tuesday, 10/28/14’s NYMO came in at 82. Given the rarity of a single reading above 80 – much less two so close together – the following study asks:
What is the NYSE Composite’s forward performance following two or more closing NYMO readings >80 in a rolling 5-day period?
Study Period: 8 years, 2012 trading days (11/01/2006-10/31/2014).
Occurrence of Two or More Closing NYMO Readings >80 in a Rolling 5-Day Period (excluding October 2014): N=9
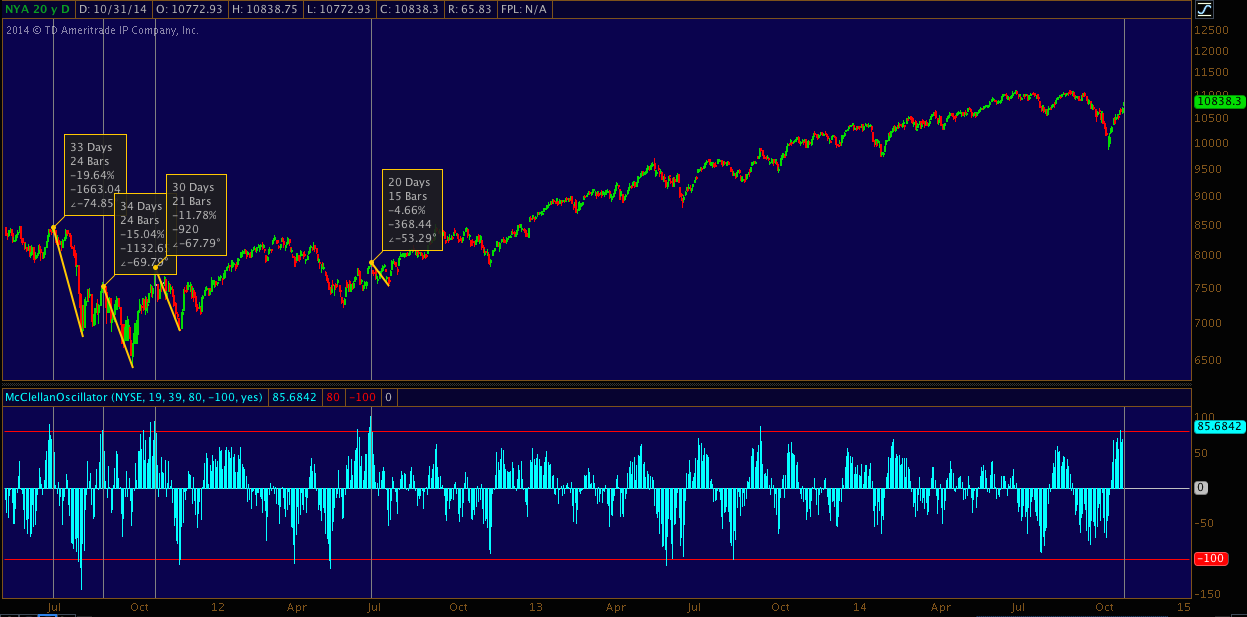
Here are those 9 occurrences across two charts. Vertical lines denote the “signal” day, on which the second >80 NYMO printed:
2006-2010:
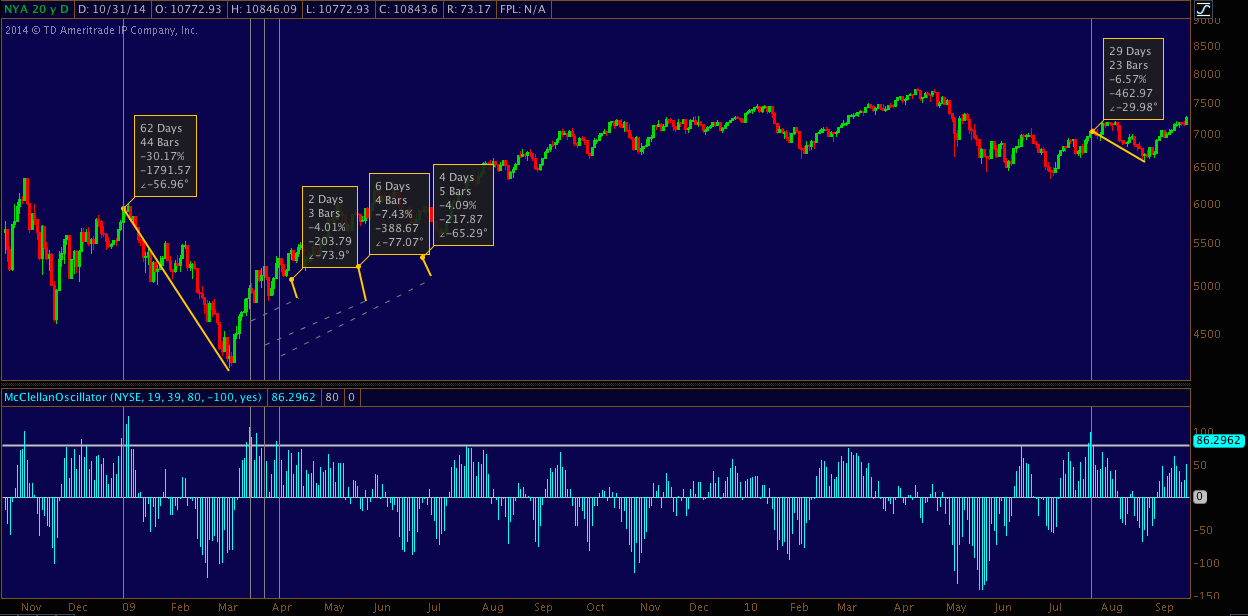
2011-2014:
Study Results:
- Of 2007 observations since November 2006, this study’s criteria have been satisfied 0.4% of the time.
- 8 of 9 occurrences (89%) began to pull back on the session following the signal day.
- 1 of 9 occurrences (07/26/2010) began to pull back 13 trading days and +2% following the signal day.
- Average pullback performance: -11.03%
- Median pullback performance: -7.43%
- Smallest pullback: -4.01% (March 2009)
- Largest pullback: -30.17% (December 2008-March 2009)
- Average pullback duration: 18 sessions
- Mean pullback duration: 21 sessions
- Shortest pullback: 2 sessions (March 2009)
- Longest pullback: 44 sessions (December 2008-March 2009)
Here’s the usual caveat: typical of this market environment, we’re studying outlying data and so a small sample space results. That said, according to this study, Monday, November 3rd’s outcome will be an important one for short and medium-term market direction.
There are a variety of applications here. The McClellan Oscillator (NYMO) helps quantify risk for 1) the next potential “buy-the-dip” opportunity for long-only investors and opportunistic position traders, 2) a potential, imminent pullback for those who may choose to lock in v. forfeit “V-bottom” gains that have built over the last couple weeks by taking profits or raising stops; and 3) time and price variables for active options traders and/or those looking for an empirically-grounded thesis for opening a short, among others.
If you’d like to plot the McClellan Oscillator for your own study, Stockcharts.com makes the indicator (3 year lookback for non-subscribers) available here.
Trade ’em Well.
Twitter: @andrewunknown
Kassen holds no exposure to securities/instruments mentioned at the time of publication. Commentary provided above is for educational purposes only and in no way constitutes trading or investment advice.


 Testing Important Price Support")
")
