 April continued 2013’s idyllic period for risk-taking everywhere. A back-of-the-napkin survey shows US stocks went up with the S&P 500 (SPX) clearing +1.85%, while Germany’s DAX added 1.5%, and Japan’s Nikkei 225 (NKD_F) an brisk 11.3%
 now entirely retraced in 2 days. Bonds also fared well, with High-Yield (HYG) moving higher 2.1%, and the long bond (TLT) posting nearly +4.7%. Predictably, traditional safe havens suffered, with the US Dollar (DX) breaking 1.7% low, the Japanese Yen (6J) shedding 3.2% and a certain shiny yellow metal (GLD) giving back 8.9%.
Little surprise then that NYSE Margin Debt hit an new nominal all-time high in April.
Around this time last month we reviewed March’s numbers, asking whether margin debt would become the next all-time high in the wake of the S&P 500’s and Dow Jones Industrial Average’s eclipse of their former records. If you haven’t caught it yet: check that post out for further detail on the value and implications of NYSE Margin Debt as a quantitative sentiment measure. It’s hard objectivity makes it insightful as a metric of market mood in a way surveys and more abstruse momentum measures are not.
It wasn’t much of a stretch from those numbers to a vault over the former high set in July 2007 of $381 billion; and indeed, April now has a new high of margin debt in the bag:
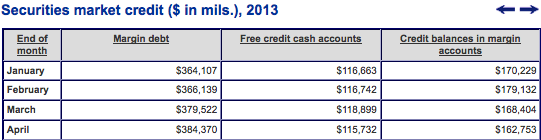
As expected, the nominal (not real, or inflation-adjusted) margin debt number is tracking the US equities’ aggregate market cap higher. This is, in part, a knock-on effect of the “rising tide lifts all boats” that is a rising market: long stock positions purchases on margin grow in value, and so does the margin debt outstanding. So this is a remarkable amount of borrowing; but before donning our tinfoil “imminent crash” hats, let’s concede a stock market almost ceaselessly stalking all-time highs day-in and day-out will post near-record or record numbers.
Don’t put away the hat quite yet – or at least keep it within easy reach in your closet. There is a more important measure to consider here – one that a) is necessary to make “margin debt” (the left column’) comprehensible, and b) a clearer measure of how much a “margin debt” increase month-over-month is a function of rising stock prices (i.e. rising market capitalization) versus a market tipsily scrambling further out on the borrowing/leverage limb.
That measure is Net Worth. For April, NYSE member organizations record an aggregate negative net worth for its participants (more-or-less “the stock market”) of just shy of $106 Billion.
That’s a steep number: almost a 15% increase month-over-month. Though it hasn’t yet been updated for the numbers out today, let’s run Doug Short’s chart tracking net worth through March’s data to put this in context:
As I noted last time:
So it’s not a record. But keep in mind: early 2000′s aggregate net worth figures are what drove the NASDAQ to 5132, a speculative peak from to which it is only beginning to appreciably recover 13 years later. Perhaps 2007′s net worth figures are more instructive: but if so, that lends little comfort. Negative net money doesn’t necessarily indicates a market top; but negative net money blowoffs (February 2000, June 2007, even Spring 2011) do appear to precede market tops.
There’s no way to tell except in retrospect whether US stocks are in a new “negative net money blowoff”. But the market’s indebtedness – the amount of floating margin debt offset by free-standing cash on-hand and credit – it has unequivocally reentered a tier reached before only at the height of the Tech Bubble. Some have argued this year “isn’t 1999”. Whatever the (lack of?) similarities to the current environment and the year that epitomized “irrational exuberance”, negative net worth agrees: it’s actually January 2000.
What kind of negative market dynamic can this net worth trend create? Looking again at last month’s post:
The key to understanding this is the concept of adversity tolerance: i.e. the degree of stress the aggregate market’s balance sheet can take. If history is any guide, according to aggregate margin debt and net worth right now “the market” is confident – highly confident. But like any bout of confidence and bull market built on rising levels of debt, the instrument of the market’s growing confidence ironically sews the seeds of its own undoing.
and
In practical terms, this means there’s little margin for error (read: selling); and little room to maneuver before margin calls occur and forced selling is required. This activity creates a downdraft that can spin a healthy pullback into a more significant correction, if not a protracted bear market. In fact, the amount of margin debt taken on ahead of these downturns demonstrates a behavioral pattern where the aggregate market is either entirely oblivious to what lay ahead or radically underestimates the depth and extent of the adverse move it will have to weather.
Occurring in a context defined by a reactive “post-crisis” market discourse and heavily accommodative Fed policy, this time may or may not be different. But if the economy has found its footing; and financial markets are finally normalizing as some suggest – if we are to judge the current market environment apples-to-apples and on a level ground with 2000 and 2007 – this latest read on NYSE Margin Debt and aggregate market Net Worth frame a worrisome picture.
Twitter: @andrewunknown and @seeitmarket
Author holds no positions in any securities mentioned at the time of publication.
Any opinions expressed herein are solely those of the author, and do not in any way represent the views or opinions of any other person or entity.

: Worrisome to Broader Market?")
