 By Andrew Kassen All-time highs? Yeah, we’ve got those.
- In early March the Dow Jones Industrial Average finally snapped its early October 2007 high at 14164; and despite some subsequent choppiness, that level has held admirably.
- The S&P 500 quickly followed suit, banishing its own October 2007 high at 1564 to the statistical dustbin in late March.
- The Russell 2000 actually accomplished this feat in April 2011 – if only by a few points before failing to push higher – and then anticipated its large cap peers by doing it again in January 2013.
- As for the NASDAQ…well, let’s just say its made a good start retracing back to its March 2000 high at 5132. In fact, January marked the first time the index closed above the 50% retracement of the dot-com crash, just above 3100.
Now another measure is on the edge of printing a fresh record, one that’s intimately correlated to the resolve with which these indices are pushing into uncharted territory: margin debt.
What is it? Toward the end of each calendar month, the New York Stock Exchange releases data on the total amount of debt carried (or “Securities Market Credit” extended) in all margin accounts at NYSE member organizations for the preceding month. Put simply: this is the total amount of money across all NYSE members borrowed by their customers to purchase securities. “Members”, by the way, are firms you’ve no doubt heard of (Fidelity, Goldman Sachs, Citigroup, BNP Paribas) and maybe some you haven’t (Battenkill Capital, anybody?)
Why Is it Significant? Principally, margin debt is a sentiment measure. What metric could be a more direct indicator of how market participants are feeling than their demonstrated willingness to borrow money to buy stocks? The amount of debt racked up in margin accounts offers a sparingly terse, effective answer to that. This isn’t a sentiment poll reliant on the mood, memory and other subjective foibles of its respondents; but a roughly comprehensive and purely quantitative, earnest-money measure of confidence. Similarly, margin debt equals leverage: borrowing capital to buy stocks carries a heightened capacity for reward (keep all the profits generated by the money you borrowed!) and risk (or apply a multiplier to how much you’re otherwise losing). In other words, margin debt is significant because it spells out how much real money real managers of capital are willing to lay on the line, and how much they’ve raised the stakes on (hopefully calculated) bets they’re taking.
With that brief primer out of the way, here are the NYSE margin debt figures for March published end-of-last-week (the number we’ve been discussing is in the left-most column):
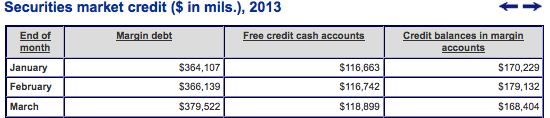
In March, margin debt clocked in at just shy of $380 billion. As for the other – sometimes overlooked, but vitally important – values in this table: they represent 1) the cash lying idle in non-margin (“cash”) accounts and 2) the credit (as opposed to the debt we’ve been talking about) on-hand in margin accounts. We’ll look at this more in a moment, but for now: the left column is a negative; the middle and right columns are a positive: put it all together and you have a concise picture of the aggregate market’s net worth.
If $380 Billion sounds like a lot of money on the line, that’s because it is. In fact, in nominal terms, March 2013 is the highest margin debt figure on record, second only to July 2007. That year, margin debt peaked 3 months before stocks did. Since we’re on the topic of all-time highs, here’s that year in full:
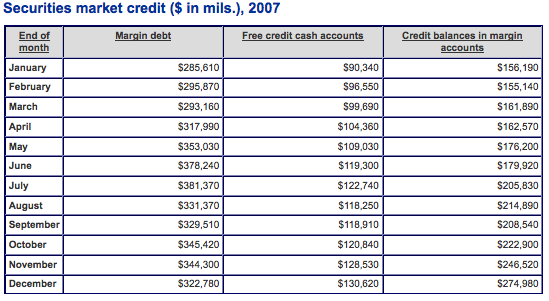
Comparing March 2013 to July 2007, you can see a nominal record high in margin debt is a small step away.
Comparing these values and dates evokes mild alarm and some pressing questions: is margin debt a leading indicator of major market turning points? Is this $350B+ a kind of “irrational exuberance” line-in-the-sand where the animal spirits that have been driving margin borrowing up and stock indices higher begins to cannibalize themselves and ultimately subvert the bull market they’ve created? What’s to prevent margin debt from rising higher? And does attainment of record levels have to mean a violent downturn, or we see margin debt moderate over time unaccompanied by a major bear market? Is margin debt telling investors to expect something like late 2007 (and after) in the near-term?
As a partial answer, there is an indisputable positive correlation between the growth and contraction of margin debt and broad-based market performance: as you might expect, the value of stocks held and the amount borrowed to hold them necessarily goes up and down as the market does. But whether margin debt’s a) rate of growth and/or b) absolute level has a causal link to market tops and bottoms is more controversial and difficult to demonstrate.
Our goal here is more modest: to review what margin debt is and see if it has any pressing relevance today.
As I mentioned earlier, the middle and right columns in the graphs above are very helpful for providing context and “anchoring” margin debt so we can speak about whether the current level of borrowing is modest, moderate or excessive.
So where are we?
Again, March 2013’s figures show “the market” as a whole is in the hole some $380 Billion. Over on the positive side of the ledger (middle/right columns above), cash and credit come to $287.3 Billion. The result: the market has a negative net worth of -$92.2 Billion.
Looking beyond raw margin debt, this net worth figure far exceeds the June 2007 high of -79B. However, it isn’t a record. As the following chart published in March (pulling from January 2013’s figures) by Doug Short shows, at its height the Dot-Com Bubble featured aggregate negative net worth exceeding -$100B for multiple months (click image to zoom):
So it’s not a record. But keep in mind: early 2000’s aggregate net worth figures are what drove the NASDAQ to 5132, a speculative peak from to which it is only beginning to appreciably recover 13 years later. Perhaps 2007’s net worth figures are more instructive: but if so, that lends little comfort. Negative net money doesn’t necessarily indicates a market top; but negative net money blowoffs (February 2000, June 2007, even Spring 2011) do appear to precede market tops. Are we witnessing just such an occurrence right now? With the impact of inflation, market cap growth and the not-so-invisible hand of the Fed the picture has never been muddier. Let’s just say the “excessive” conditions that prevailed in pre-QE world are here once again. The environment is different; but history may rhyme, despite those forces arrayed against that outcome.
The key to understanding this is the concept of adversity tolerance: i.e. the degree of stress the aggregate market’s balance sheet can take. If history is any guide, according to aggregate margin debt and net worth right now “the market” is confident – highly confident. But like any bout of confidence and bull market built on rising levels of debt, the instrument of the market’s growing confidence ironically sews the seeds of its own undoing.
If stock indices do take a sizable turn south, judged in historical terms the depth of the market’s negative net worth means it has very little tolerance for that kind of adversity. In practical terms, this means there’s little margin for error (read: selling); and little room to maneuver before margin calls occur and forced selling is required. This activity creates a downdraft that can spin a healthy pullback into a more significant correction, if not a protracted bear market. In fact, the amount of margin debt taken on ahead of these downturns demonstrates a behavioral pattern where the aggregate market is either entirely oblivious to what lay ahead or radically underestimates the depth and extent of the adverse move it will have to weather.
Market timing with sentiment measures is a very difficult business; but as a contrarian read on the environment, polls and stats like margin debt and net worth can be invaluable inputs to a process that makes more quantitative assessments of risk. Right now, the confidence reflected in that input – its own emerging bubble in certainty – counsels heightened caution.
Twitter: @andrewunknown and @seeitmarket
Author holds no positions in any securities mentioned at the time of publication.
Any opinions expressed herein are solely those of the author, and do not in any way represent the views or opinions of any other person or entity.


 Sending a Warning to Tech Stocks?")


