After I post charts and opinions, I like to go back a few months later and see how things have progressed. Today I’ll be updating some Gold charts that have been posted over the past few months. And more specifically, I’ll be alluding to my July 27th article on Gold Futures where I made the case for lower Gold prices.
In that post, the highlights were:
- A longer-term target of 1033.4.
- The consolidation phase of gold since mid-2013 with the trading range increasingly becoming smaller. The trading range narrowed from $252 to $59 on a weekly basis.
- At that time, gold was trading at 1308.5.
Lets take a look at an updated chart and see what has transpired in the past 3 months.
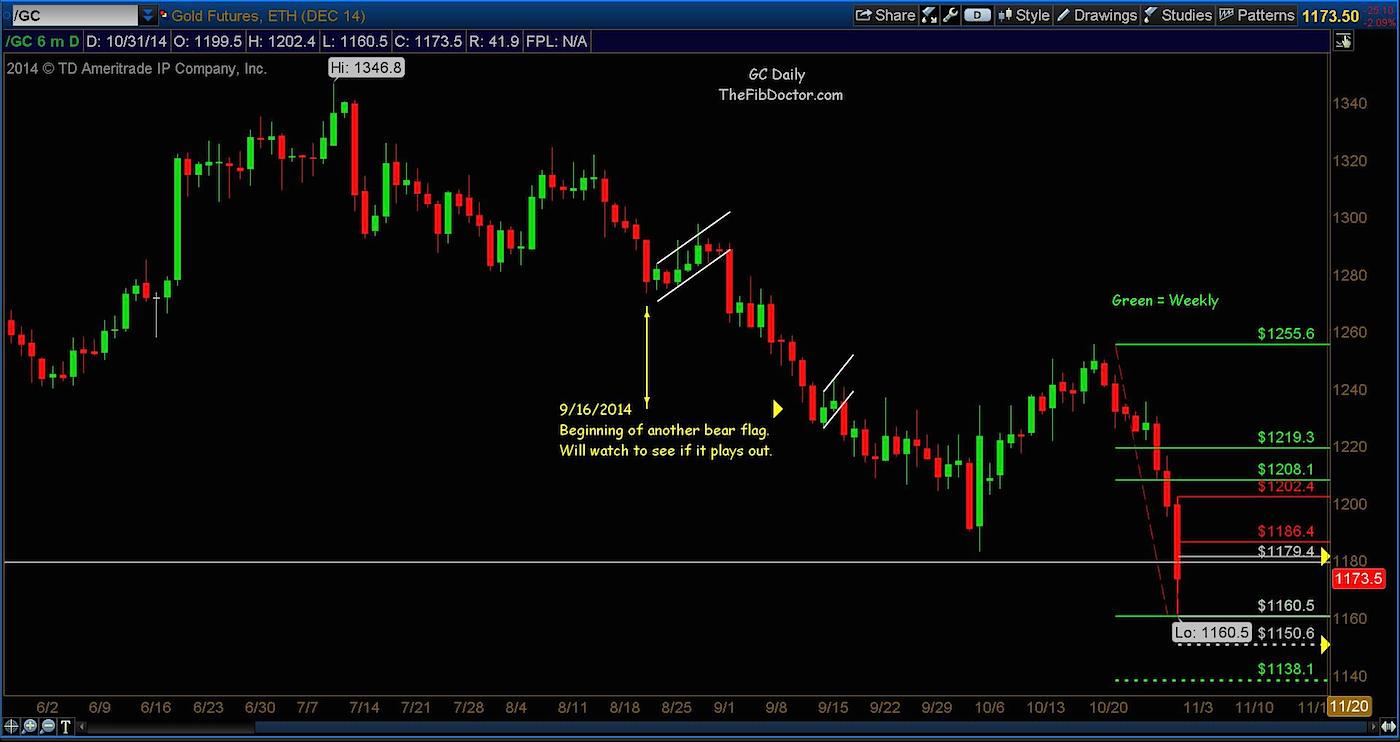
In the chart below, you can see Gold has broken several support levels on the daily chart as well as the weekly. It’s currently trading at 1173.5 or a decrease of -10.31% since July 27th. The current daily target is 1150.6 and the weekly target is 1138.1.
More importantly, gold closed Friday, October 31st, below a crucial support level of 1179.4. I’ll explain the significance of that level in a separate chart.
Gold Futures 6 Month, Daily Chart
Now, why is 1179.4 a crucial support level? In the chart below you’ll see 1179.4 was the low on June 28th, 2013. On December 31st, 2013, gold made a low of 1181.4 and on October 6th, 2014 a low of 1183.3; in essence you have a triple bottom, (if you believe in such things), that has now failed.
It is worth noting that on July 26th, 2010, gold made a low of 1155.6 which could be perceived as a sliver of support for desperate bulls.
Gold Futures 3 Year, Daily Chart
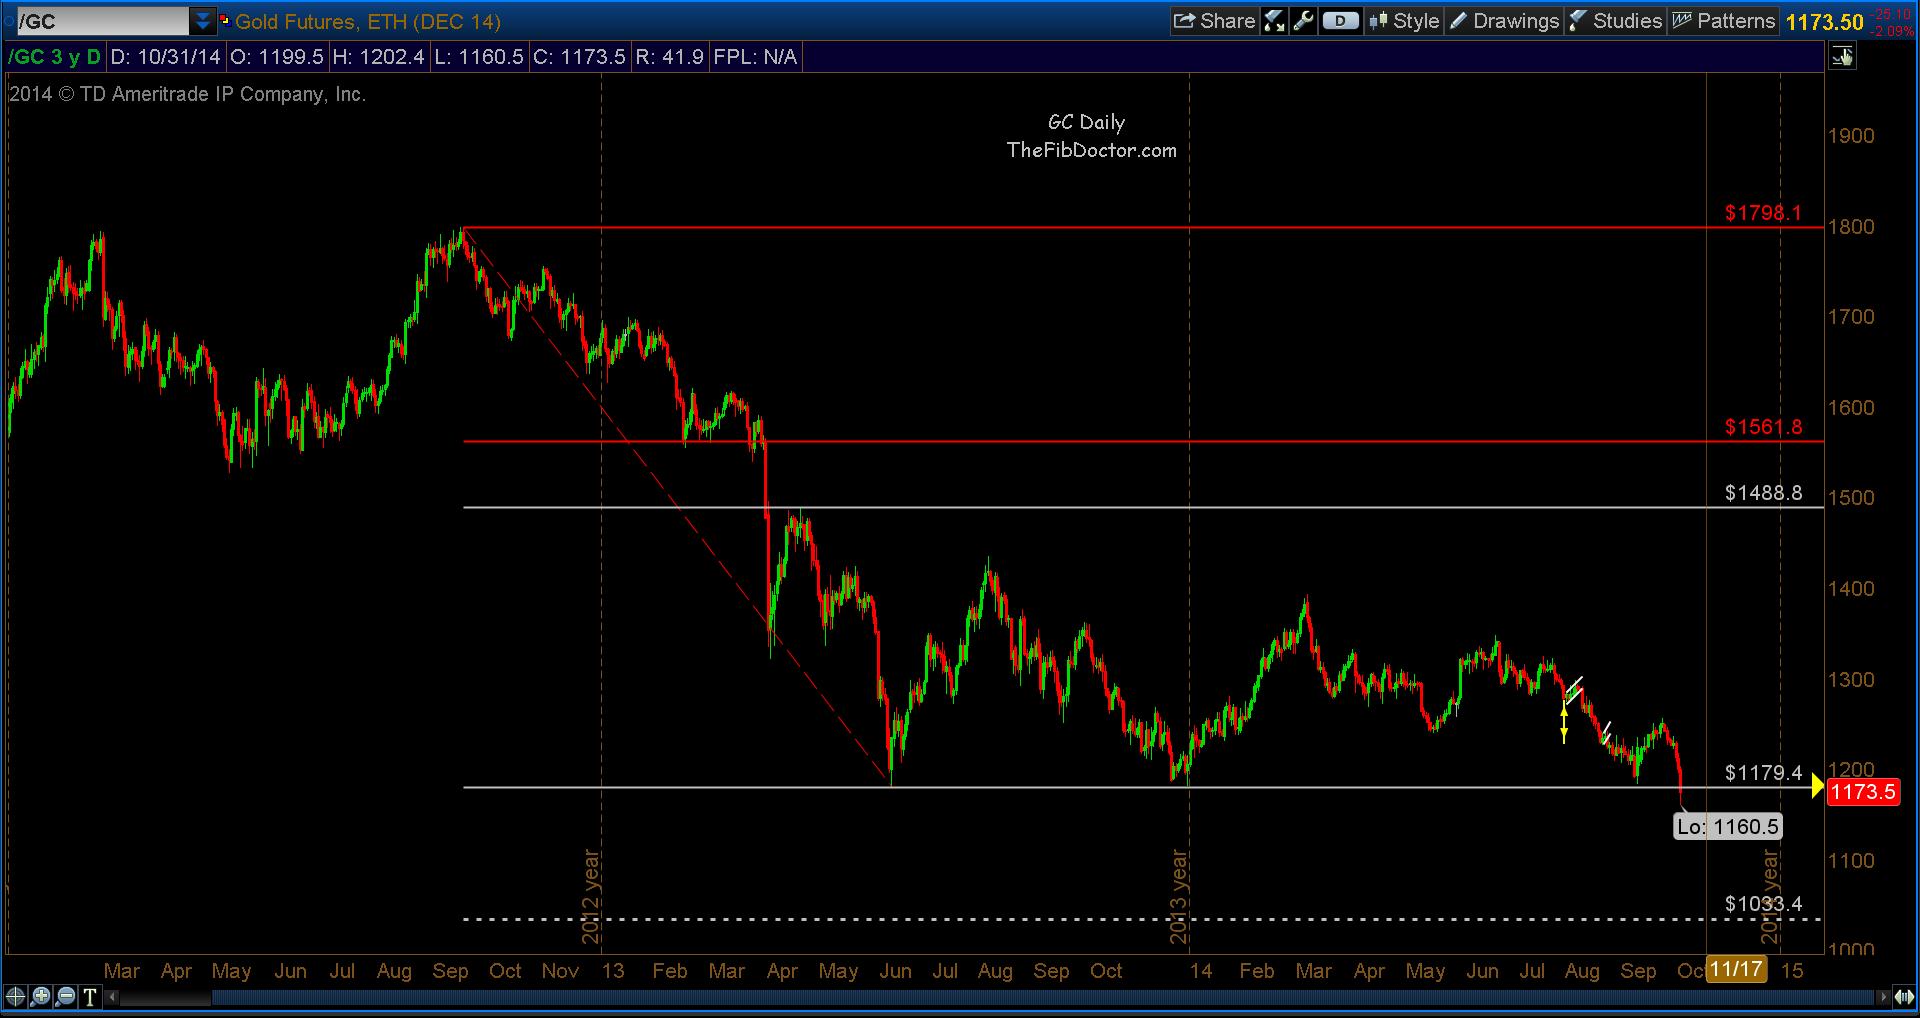
The above chart of Gold Futures is a textbook example of the point I hope I was able to make in an article I wrote here just recently.
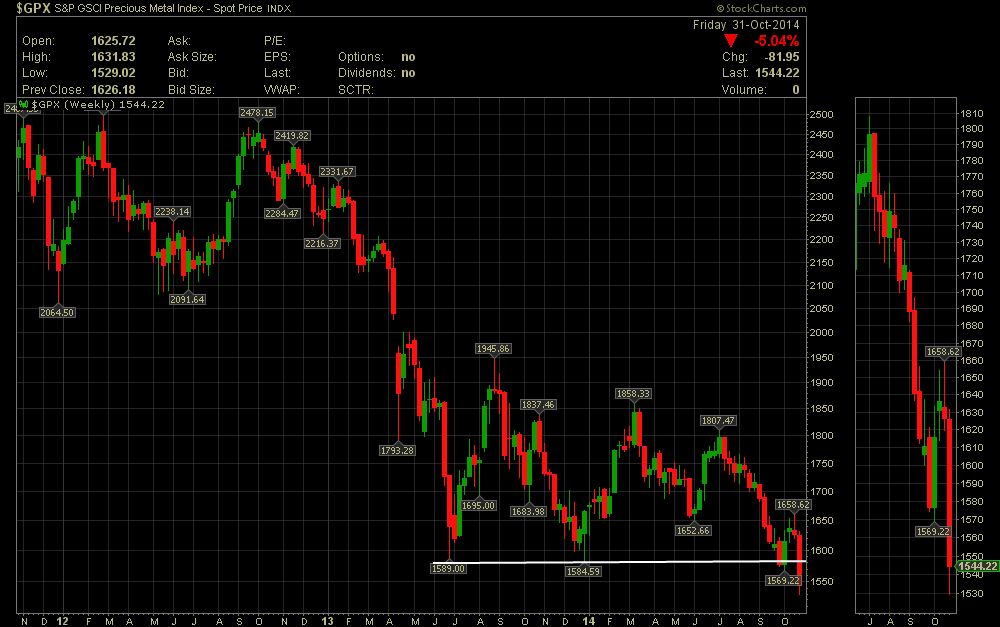
And let’s not forget the Goldman Sachs Precious Metals Index (GPX). In this article from September 10th, I showed 3 levels of support at 1652.66, 1589 and 1584.59. In the below chart you can see all three levels have been broken.
This week saw the GPX give up another -5.04%.
Goldman Sachs Precious Metals Index (GPX)
Follow Dave on Twitter: @TheFibDoctor
No position in any of the mentioned securities at the time of publication. Any opinions expressed herein are solely those of the author, and do not in any way represent the views or opinions of any other person or entity.
: Creating Bullish Divergence?")

 and Semiconductors (SMH): Concerning Price Pattern?")
 and Semiconductors (SMH): Concerning Price Pattern?")


