Both gold and silver continue to lose favor with investors as evidenced by precious metals continued weakness into September. This also shows up in technical analysis, so let’s review some charts.
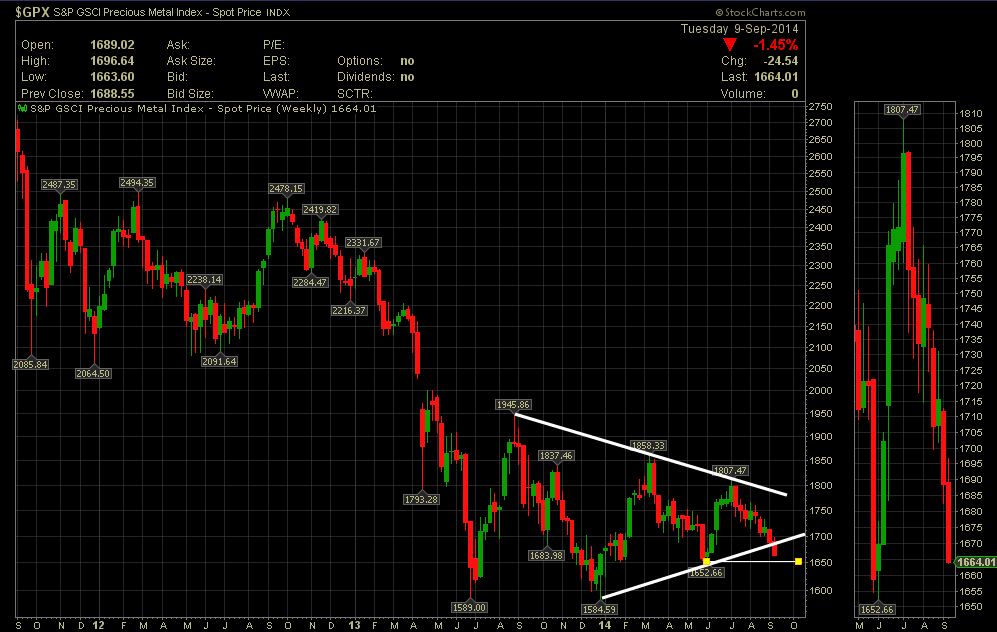
Starting with a broader look, let’s break down the 3 year chart below of the Goldman Sachs Precious Metals Index (GPX).
There are three very important support levels to watch right now:
- 1589 – The weekly low in June, 2013
- 1584.59 – The weekly low in December, 2013
- 1652.66 – This is arguably the most important level. It is the weekly low of June 2014. And the current low of 1664.01 is only $11.35 from that all important June ’14 low. A close below this level on a weekly candle will only add more fuel for the precious metals bears.
Precious Metals Index Chart
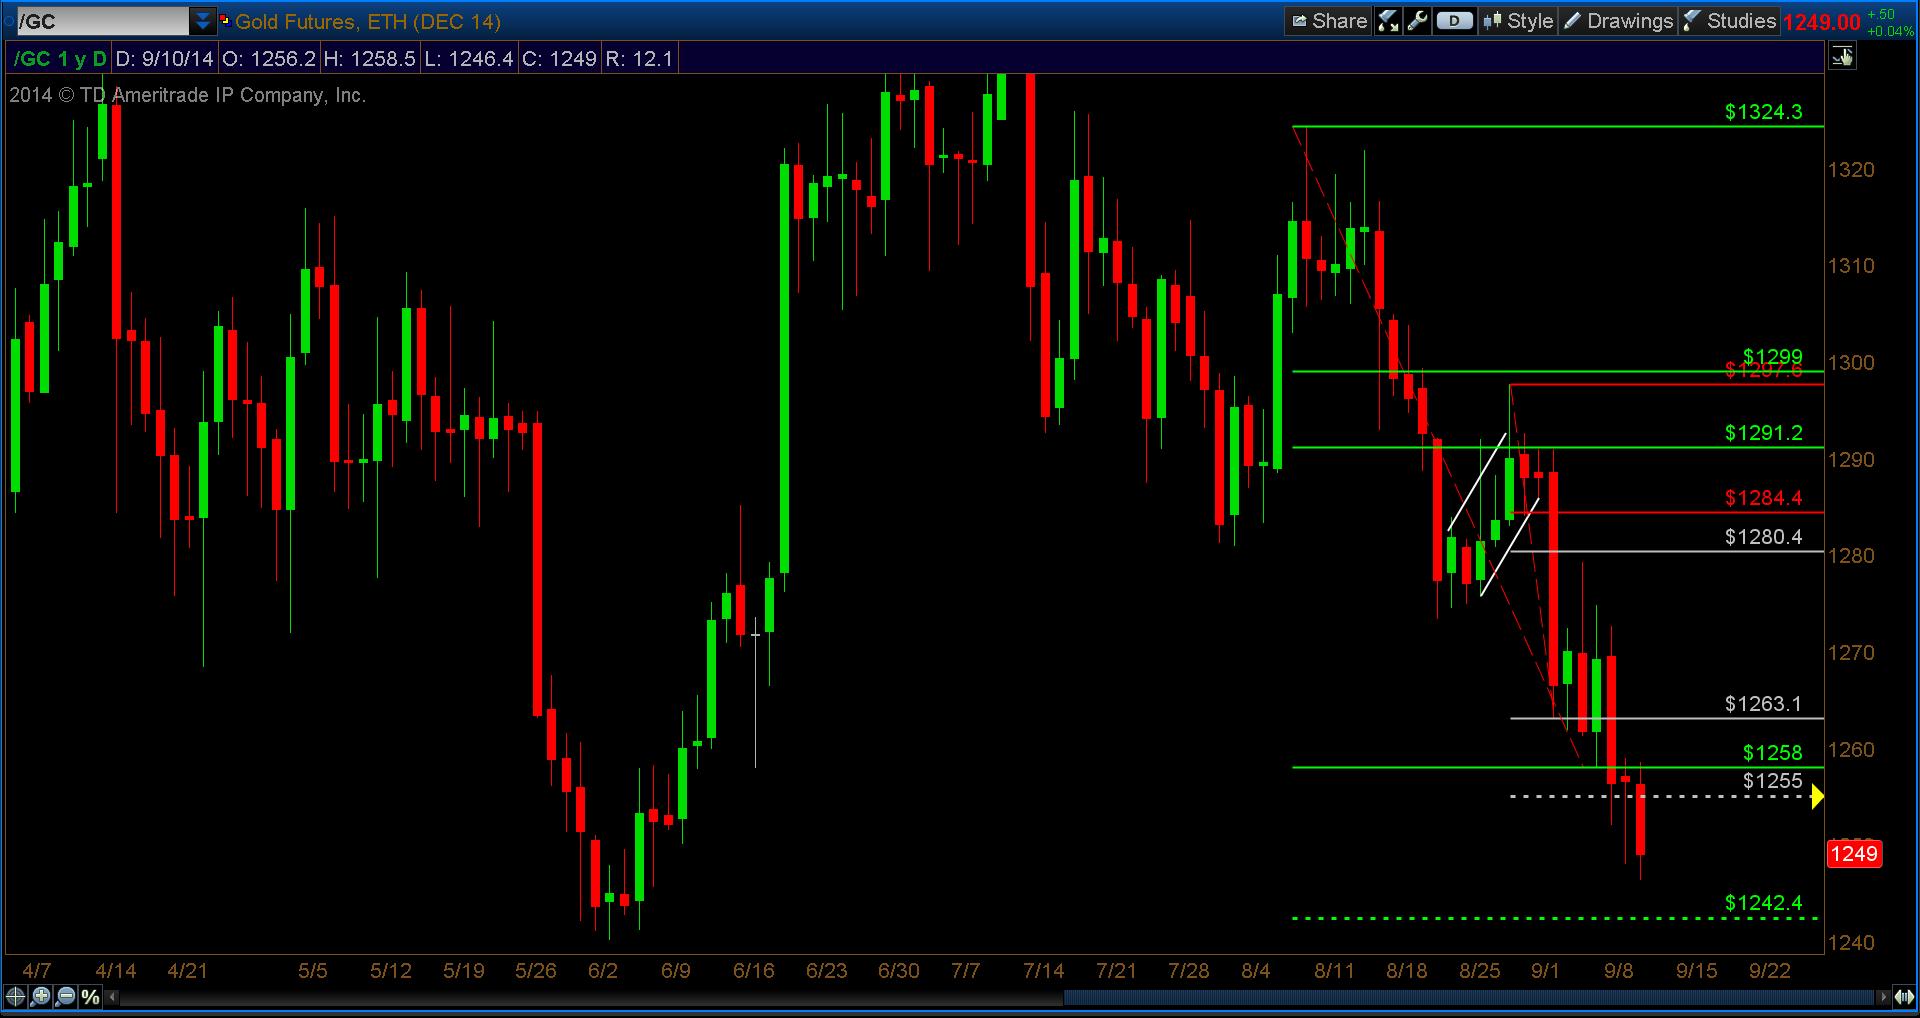
Now let’s look at a daily Gold chart. The daily target is 1255 which has been hit 3 times. Price will normally hit a target and then move away from it in the opposite direction. As you can clearly see, the bounces have been very weak and as I type this, price has dropped well below the target.
The weekly target of 1242.4 is certainly within striking distance now. A close below this weekly target will significantly weaken gold.
Gold Futures Weekly Chart
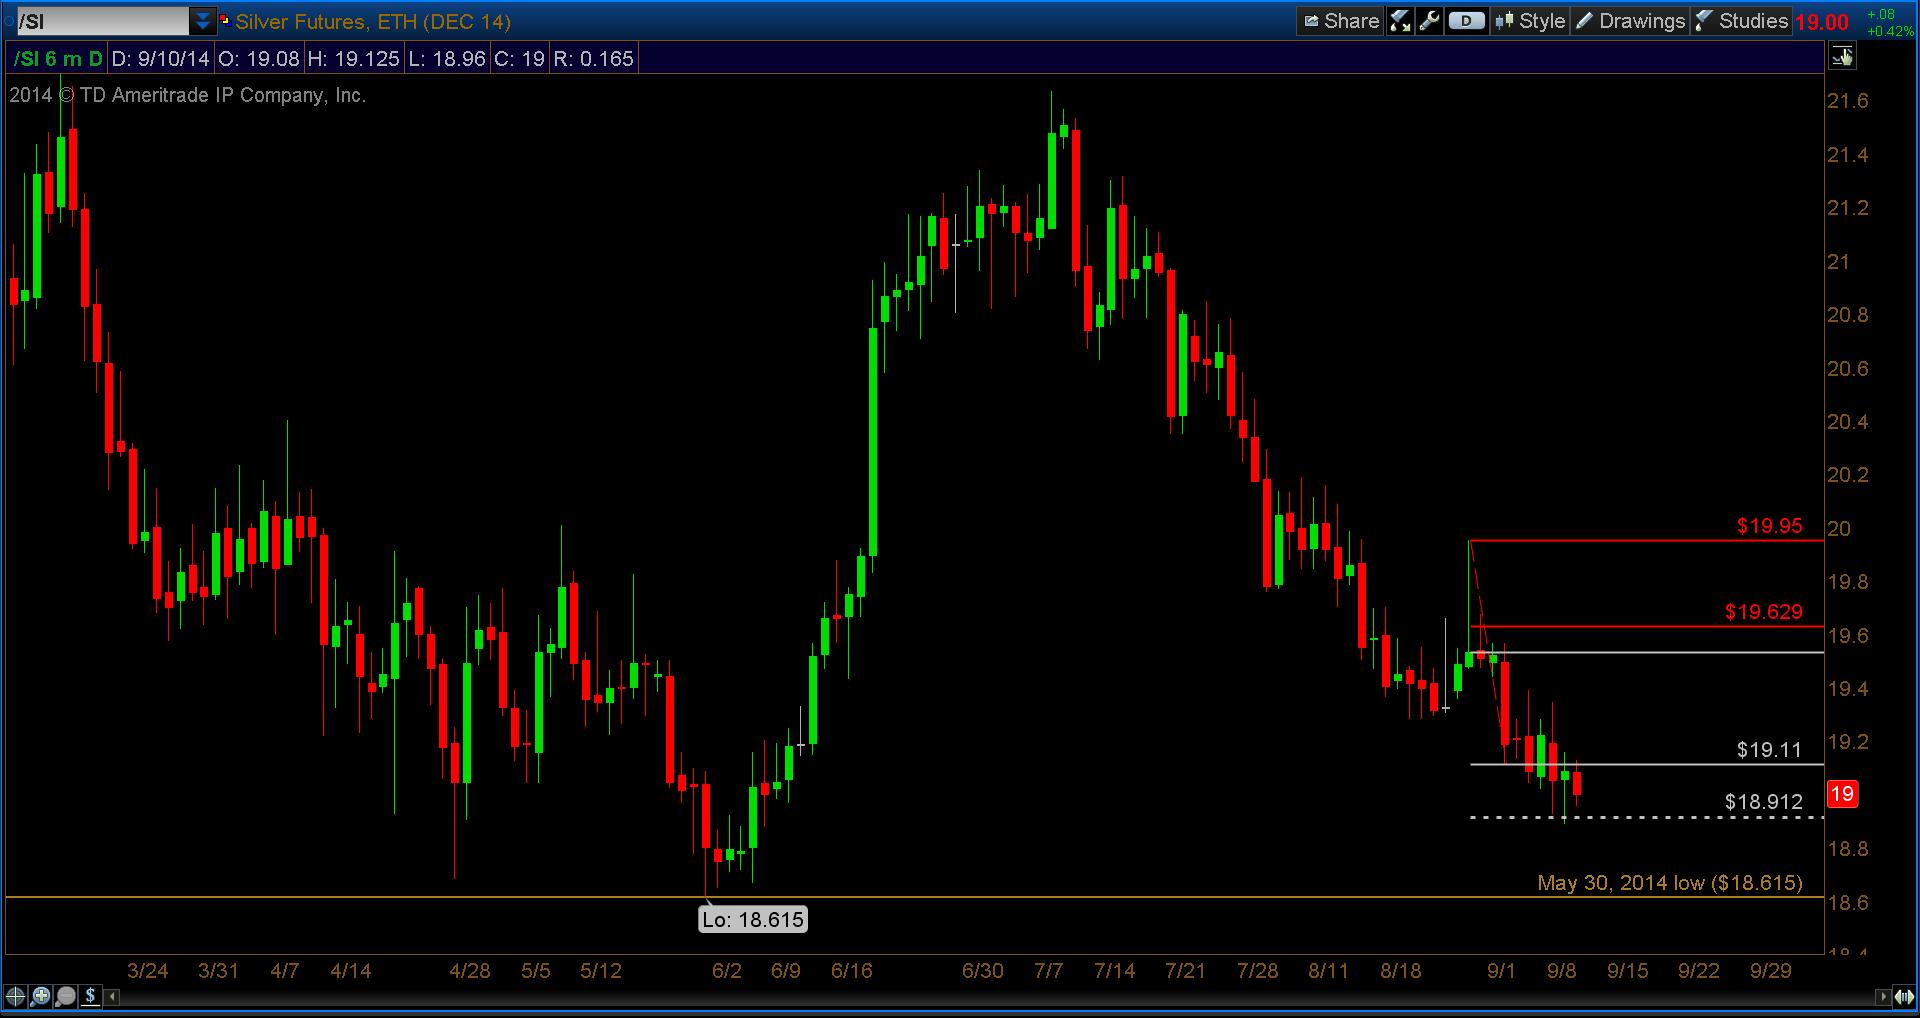
And lastly, Silver. On a daily chart, silver has hit it’s latest target of 18.915. As we saw in the gold chart, the bounce has been very weak. The number to watch right now is 18.615, the low of May 30th, 2014. A close below that level will also significantly weaken silver.
Silver Futures Daily Chart
No position in any of the mentioned securities at the time of publication. Any opinions expressed herein are solely those of the author, and do not in any way represent the views or opinions of any other person or entity.

: Showing Some Signs of Emerging Strength")
