As the Federal Reserve releases its final FOMC statement of 2013, the Gold market remains jittery. And that is for good reason: Equities have been in favor for much of the past two years and the Fed has been trying to prepare the markets for ‘tapering.’ And Gold prices have taken notice. As well, it shouldn’t be lost on investors that Gold’s collapse correlates directly with a lack of fear in the markets (see the equities vs bonds vs gold chart in this recent post).
So what will come out of the Fed into 2014? Equities? Will fear return to the markets at some point in 2014?
One thing is for sure: Gold investors are ready for a new year of price discovery. With this in mind, here are 4 Gold charts that investors should consider heading into 2014.
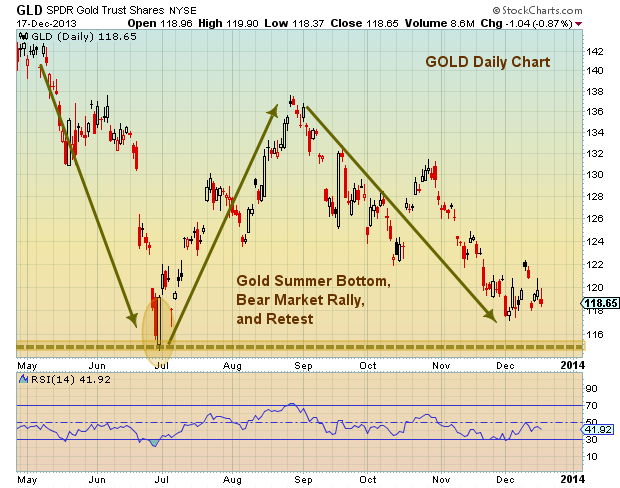
1. Gold Charts – GLD Daily Chart
After rising out of the late June waterfall bottom, Gold prices have retreated and are now retesting those lows. Could this be the start of a bottoming pattern? Gold bulls would like to see prices hang in and around these levels (either a marginal new low, or a fast and furious final “V”).
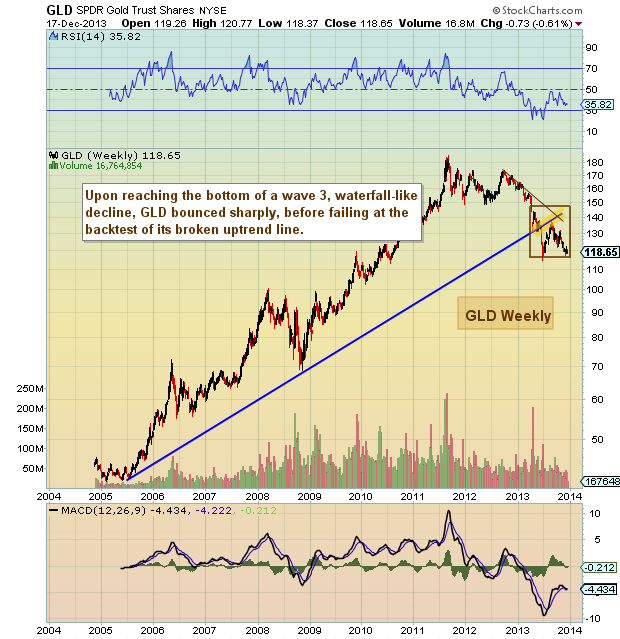
2. Gold Charts – GLD Weekly Chart
Gold backtested the bull market uptrend line and failed. A break above the August highs will be required for a new “leg” higher to begin.
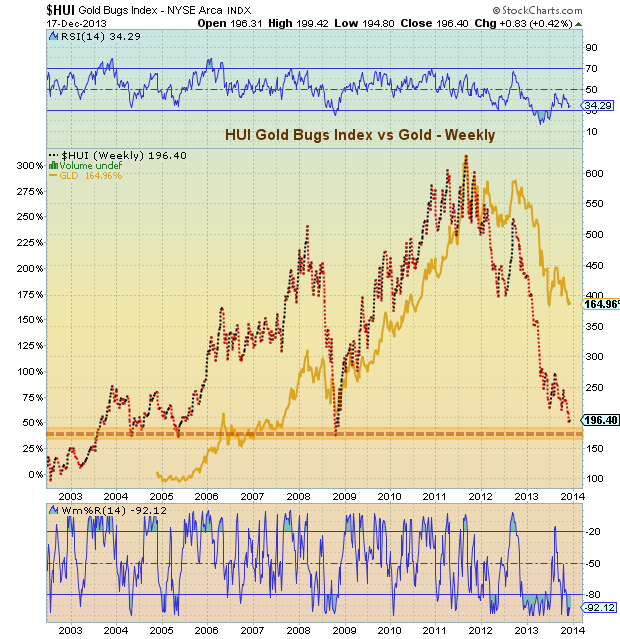
3. Gold Charts – Gold Bugs Index (HUI) vs Gold (GLD)
The Gold Bugs Index is approaching support near the 2004, 2005, and 2008 lows. Could this assist with Gold’s bottoming process into 2014?
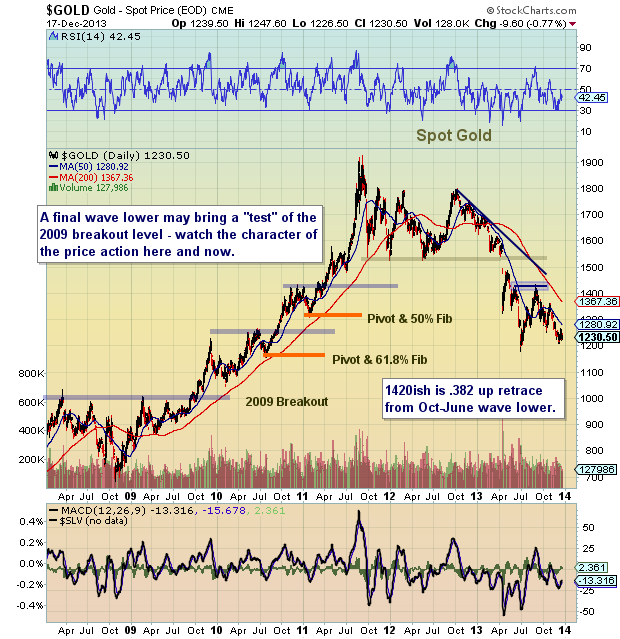
4. Gold Charts – Spot Gold Fibonacci Retracement Levels and Areas of Interest
I posted this gold chart early in 2013 and received some skepticism about Gold dropping below $1500. With Gold near 1200, it wouldn’t be out of bounds to see Gold test the $1000 level. A puncture of $1000 would shake out may Gold investors and perhaps offer an excellent buying opportunity. Remember, securities tend to bottom when even the most passionate supporters begin to question/sell. For now, the 61.8 Fibonacci retracement level is holding.
Hope you enjoyed the Gold charts. Thanks for reading. Trade safe. Twitter: @andrewnyquist
No positions in any mentioned securities at the time of publication. Any opinions expressed herein are solely those of the author, and do not in any way represent the views or opinions of any other person or entity.


 Pressuring Lower Price Support")


 Pressuring Lower Price Support")