The Energy Sector (XLE) has been an awful performer over the last several months. While consumers cheer at the decline of prices at the pump and economists get anxious about the impact of falling oil prices will have on GDP. Luckily as technicians we aren’t as concerned about why a market acts the way it does.
Back in July I wrote about the bearish chart setup for the energy sector and why I thought it was due to pullback. On Monday, I showed the chart of the relationship between XLE and SPY, with it being the first time monthly momentum having entered ‘oversold’ territory. Being the worst performing sector year-to-date, is it time to start looking to catch the falling knife?
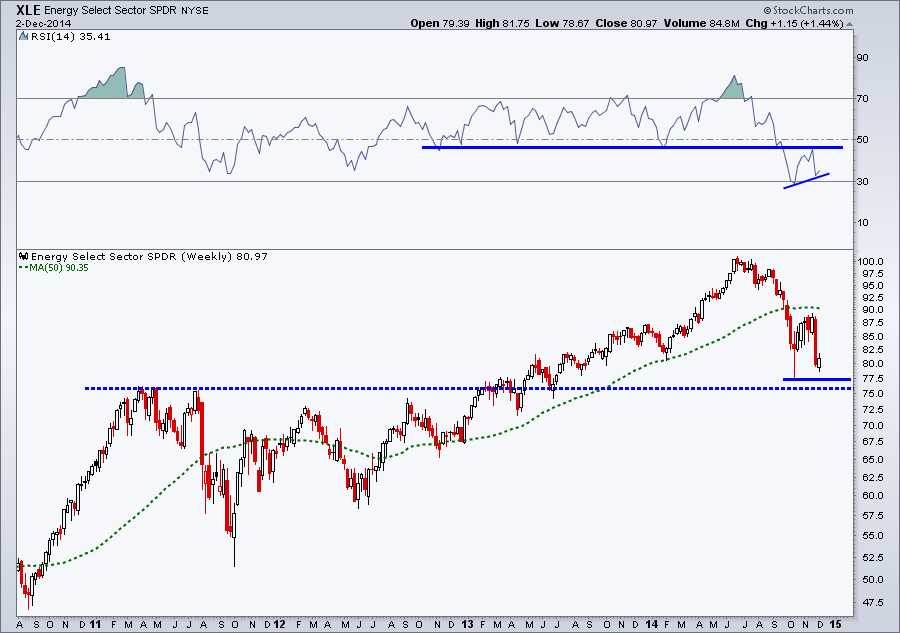
Below is a weekly chart of the Energy Select SPDR ETF (XLE) going back to late 2010. Looking at the right hand side of the chart which shows the latest set of price action we can see in the top panel that the Relative Strength Index has created a bullish divergence. In mid-October the momentum indicator made a significant new that was then followed by a higher low in November as price broke down. This is a positive sign that momentum may be bottoming which could lead to XLE gaining some of its lost ground.
I’ll be watching going forward if the momentum is able to break above its prior lows as highlighted by the horizontal line going back to 2012. Momentum needs to break back above these lows to help confirm a bullish setup for the energy sector. I would also like to see XLE clear its 50-week Moving Average (dotted green line) which would also put it above its November high.
If price does continue to weaken then the possible levels of support could be the prior October low around $77.50 as well as the 2011 high that took place before the previous intermediate-term decline. If price is able to get under $75.00 then it will likely have ‘open air’ with little support left for energy bulls to hang on to.
XLE Energy Sector – Weekly Chart
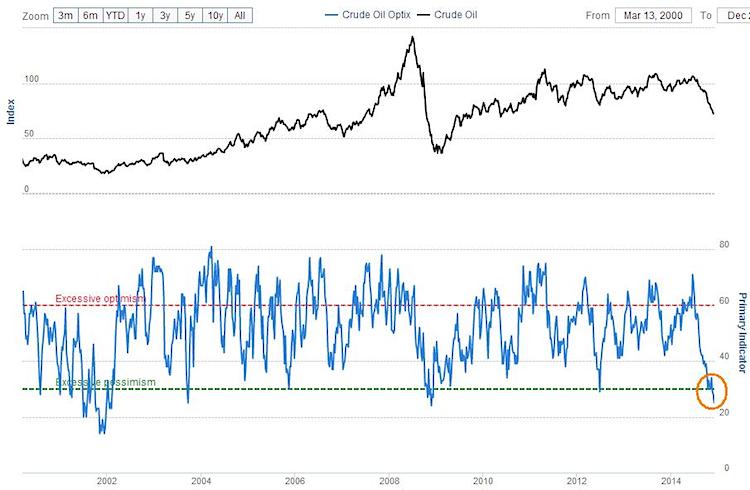
Turning our focus to sentiment, the Optimism Index for Crude Oil as created by SentimenTrader is at historic lows. Even after oil crashed from $140 to $37 in 2008 sentiment was still more optimistic than it is today. We have to go back to 2001 to find levels in sentiment that are lower than they are today.
Crude Oil Sentiment Chart
It seems no one likes the energy sector or crude oil anymore and for contrarian traders, that’s music to their ears! It’s possible we see sentiment continue to drift lower but it’s also possible that the 10% decline on the Friday after thanksgiving shook out the last set of weak hands, leaving few left to sell.
Finally, based on the Stock Trader’s Almanac, the bullish period of seasonality for crude oil begins in December. The bearish period of seasonality for the commodity lasted between September and November, which helped make the downturn in oil much less of a surprise as it dropped 30% during that time period. Will the changing of the seasonal tide help bolster crude oil and in turn the energy sector? Can the bullish divergence in momentum and the historic low in sentiment help give confidence to the bulls? We’ll see.
The information contained in this article should not be construed as investment advice, research, or an offer to buy or sell securities. Everything written here is meant for educational and entertainment purposes only. I or my affiliates may hold positions in securities mentioned.
Follow Andrew on Twitter: @AndrewThrasher
Any opinions expressed herein are solely those of the author, and do not in any way represent the views or opinions of any other person or entity.

: Showing Some Signs of Emerging Strength")
