 Well, that didn’t take long. In just under 6 weeks, the Emerging Markets ETF (EEM) has corrected nearly 6 percent. Today alone, EEM declined 1.52%. A stronger dollar, Russian sanctions, and worries about global growth (i.e. the Euro zone) have likely played a role in stalling the Emerging Markets rally. To be fair, though, the pullback is still within the bounds of what might be expected after rallying nearly 25 percent off the February lows. And this bring is why following the price action is so important.
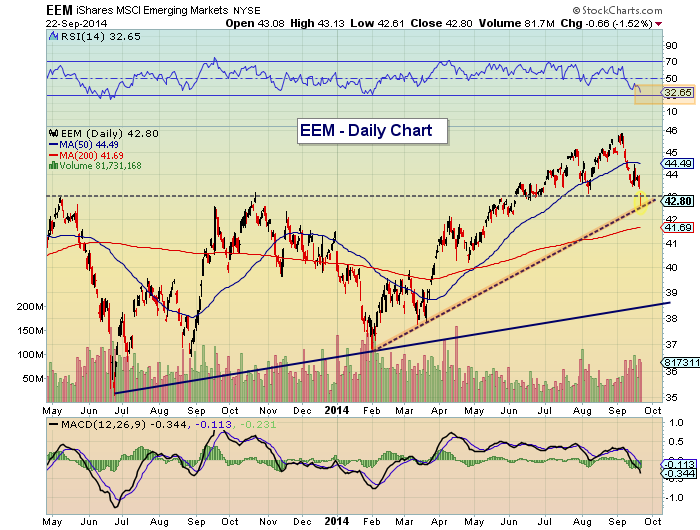
But it’s a bit more complicated than that… especially after today’s drop. Below is a daily chart of the Emerging Markets (EEM). And there are 3 things that traders should be aware of:
- EEM gapped lower and took out the lower band of lateral support around $43. Bulls need EEM to retake that level. and then some The longer it stays under $43, the higher the odds that the index falls into a correction.
- EEM traded near trend line support today. This trend line comes together from the February lows and remains the lone price support until the 200 day moving average.
- The Relative Strength Indicator (RSI) is nearing 30 and any reading under 30 indicates that a security is oversold. This implies that EEM is nearing a short-term bottom.
EEM – Emerging Markets Daily Chart
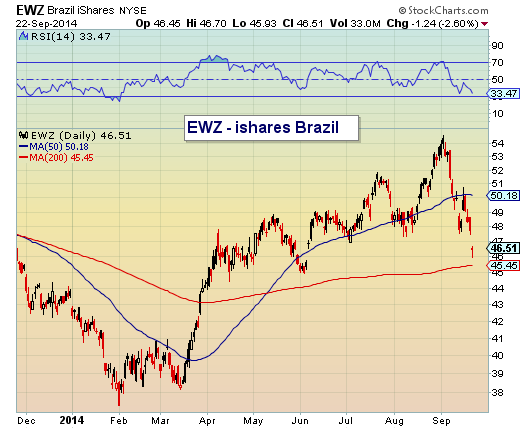
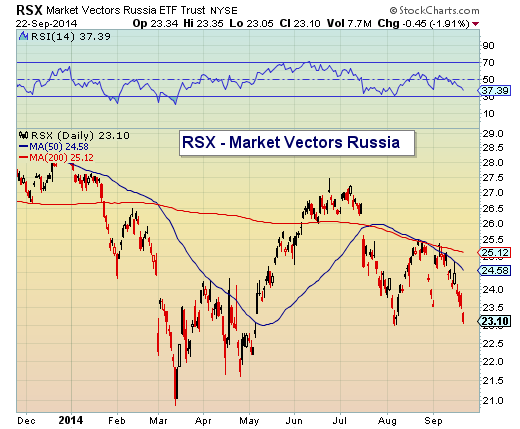
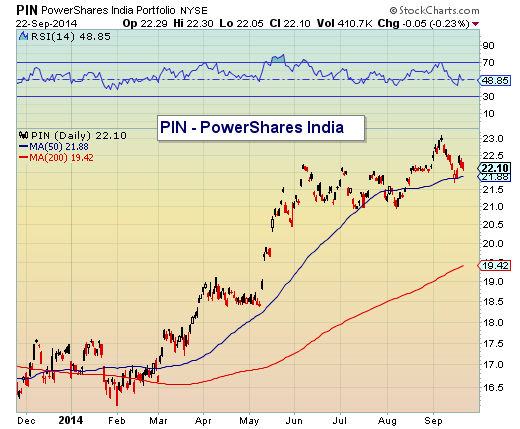
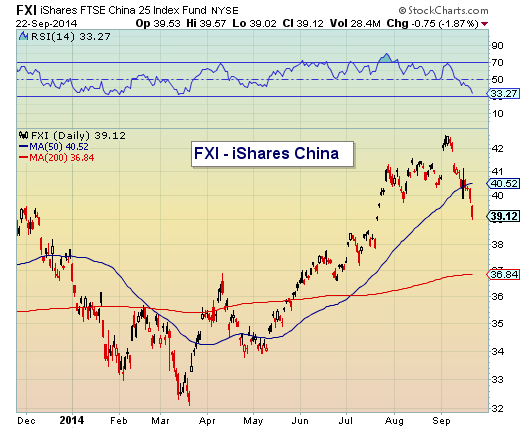
To offer some further insight and perspective, let’s take a look at the performance of the BRIC countries as well. Many of the charts look similar to EEM and also demonstrate why the coming days are likely important. India’s ETF (PIN) has experienced the smallest pullback, while China (FXI) has fallen in line with EEM and Brazil (EWZ) and Russia (RSX) have seen full corrections of 10 percent or more.
EWZ – iShares Brazil
RSX – Market Vectors Russia
PIN – PowerShares India
FXI – iShares China
No position in any of the mentioned securities at the time of publication. Any opinions expressed herein are solely those of the author, and do not in any way represent the views or opinions of any other person or entity.


")
