Following yesterday’s nearly 20 point fade from the highs near 1190, the Russell 2000 Mini Futures (TF) consolidated during European trade in a narrow lateral channel between 1169-1171. All that was lacking, it seems, was a catalyst worthy of notice which arrived in the form of renewed overtures of peace and a possible cease-fire between the Ukrainian military and their pro-Russian adversaries, even as the latter opens and advances along a new front with the barely-clandestine tide-turning support of Russian infantry and heavy armor. Once the range break triggered, TF drove higher in thin, program driven trade to the mid-1170s.
Market response following the ECB’s 0745ET release of their latest round of rate cuts was positive, but muted following the gains that preceded the release.
Draghi noted the ECB wanted to be careful to “make sure there’s no misunderstandings on whether we’ve reached the lower bound…now we are at the lower bound.” Leaving no shadow of doubt, here’s how the ECB’s official twitter handle put it (rather unequivocally and free of hedging or obscurantism for the Age of Forward Guidance):
Draghi: Rates at the lower bound now
— ECB (@ecb) September 4, 2014
See It Market’s Andy Nyquist noted the resulting volatility and huge range that followed in the wake of the ECB’s announcement, with DM equities holding their overnight gains while sovereign debt was bid but shed after Draghi began speaking, and the Euro broadly sold into an already historic decline with EUR/USD poised to record 8 consecutive down weeks for the first time in its history.
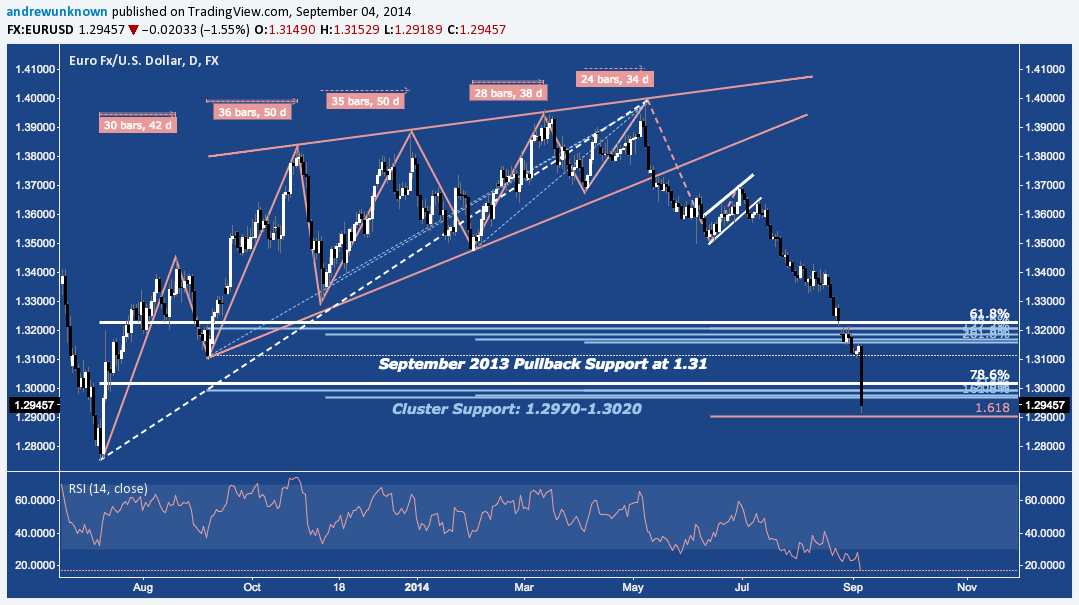
The short-term technical damage to EUR/USD is extensive. Major fibonacci cluster support around 1.30 was sliced through today as if it weren’t there in unremitting selling. To wit, the pair’s 14-Day RSI is at 16, a level exceeded on only 2 days (in mid-September 2008!) since the Euro began trading. The pair remains in close proximity to the 1.30 fibonacci cluster, suggesting EUR/USD bear pressing their advantage here will meet with ill-fated consequences.
EUR/USD – Daily: Staggeringly Oversold Into Cluster Support
This syncs up well with the effective attainment of the US Dollar Index’s (DX) primary 9-month double bottom target at 83.95 – it should, given the Euro’s 56% weighting (of 6 constituents) in DX. This upside objective coincides with the 78.6% retracement of the last year’s range (85-79) near 83.70 and long-term descending trend line resistance, noted below. It has been an unmitigated slow-mo melt-up since the ECB’s mid-Summer meeting on July 3:
US Dollar Index (DX) – Daily: A Confluence of Resistance
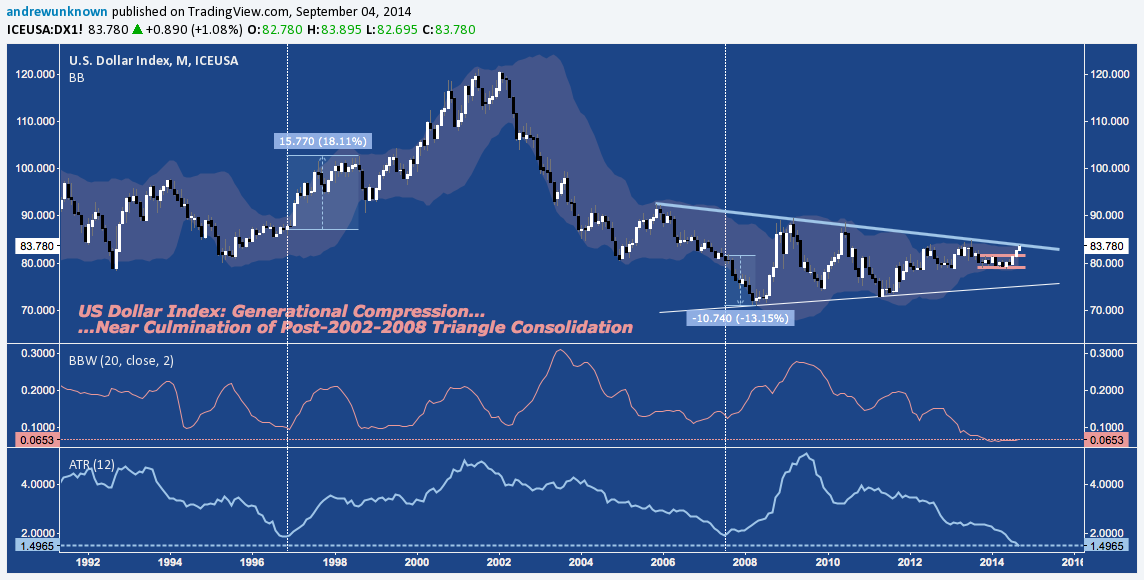
That descending trend line belongs to the 8-year symmetrical triangle that has been consolidating 2002-2008’s 40% decline in the US Dollar Index. Greenback strength (or is it just a very tardy revaluation lower of the Euro?) has brought DX back to the top trend line – without a visit to the bottom of the triangle. This partial decline deserves emphasis: USD bears’ inability to take the index back to 75 heightens the probability the pattern will resolve upward. The implications are enormous, suggest sustained EUR weakness is ahead. In a broader context, a long-term breakout is due on DX, with its Bollinger Bandwidth (a measure of standard deviation from DX’s moving average) and Average True Range demonstrate the index is trading in a more compressed fashion than it has in at least 25 years. The last two times DX’s Yearly ATR came close to this low, the moves following were immediate and significant:
US Dollar Index (DX) – Monthly: Is the Partial Rise Presaging a Cyclical Breakout Higher?
Taken together, EUR/USD is poised for a relief rally; or at least a significant short-term consolidation. Momentum is utterly crushed. Commitments of Traders data on the CME’s Euro FX Futures (E6) contract indicates speculative positioning on the Euro is heavily biased to the short side. As Nyquist notes, “Traders will have to determine if [Thursday, September 4th’s] moves are a sign of capitulation…or a sign of trend affirmation”. In consideration of multiple timeframes and in fulfillment of the market’s mission to frustrate the most people it can, it may be both, with the Euro heading higher in the short-term – just long enough to alleviate the highly polarized market before short Euro positioning redoubles and Greenback sees a long-term breakout above 84-85. As volatility picks up, active investors and traders will be challenged with the difficult task of balancing simultaneous Euro and USD relative strength across different time horizons.
And Small Caps?
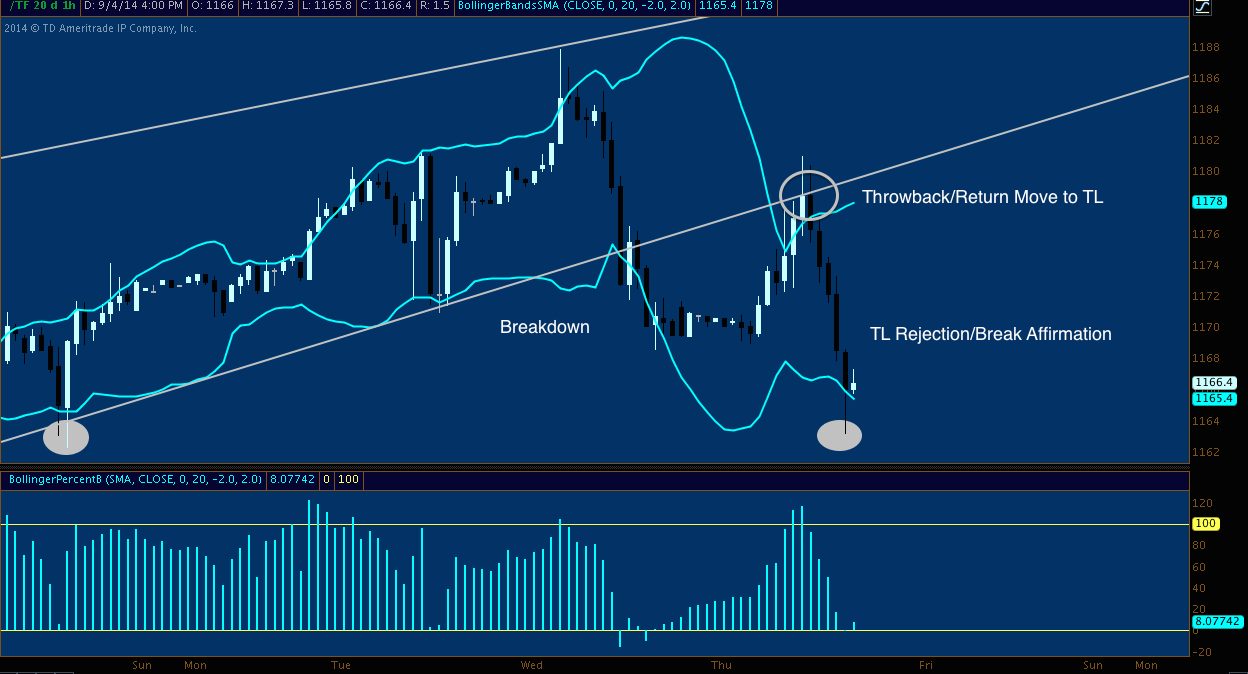
Turning back to today: following the US open, however, the immutable fundamental realization clocks in NYC had struck 09:30:00:00:01. TF pushed higher, cresting above 1181 to tag the 61.8% fibonacci retracement of yesterday’s decline. The rest of the day was spent with the index increasingly pushed back on its heels. You’ll notice today followed yesterday’s script closely, spiking early on “news” above the upper Bollinger Band to tag trendline resistance before rolling over. But for the similarity of these sessions, the progression they create shouldn’t be lost. Wednesday’s pop was a corrective high, trend intact. Today’s pop-and-fade represents a failure to recapture the trend line support broken on Wednesday. Check out how the classic throwback pattern played out:
Russell 200 Mini Futures (TF) – 1-Hour: Broken. Thrown Back. Rejected.
A Multi-Timeframe Look at the Context of Russell 2000’s Broken Rising Wedge
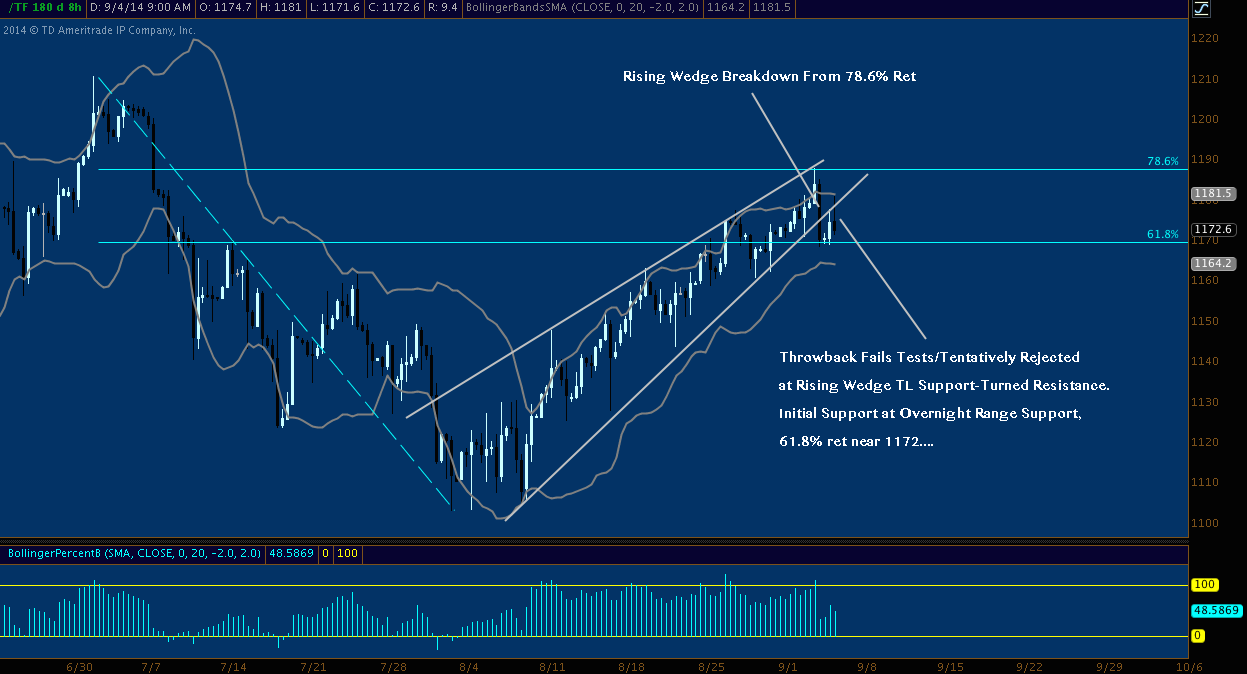
Way out on the ledge of a month-long Rising Wedge pattern, Wednesday’s high just tagged the 78.6% retracement of TF’s Summer range (roughly 1100-1210) before shedding the day’s gains and finishing below the wedge. Now Today’s early failure to reclaim August’s corrective rally trajectory and close below of 1168.6 have confirmed the break, throwing the first real red flag on the Russell 2000 in 4 weeks.
Russell 200 Mini Futures (TF) – 8-Hour: Wedge Broken At Key Fibonacci Level
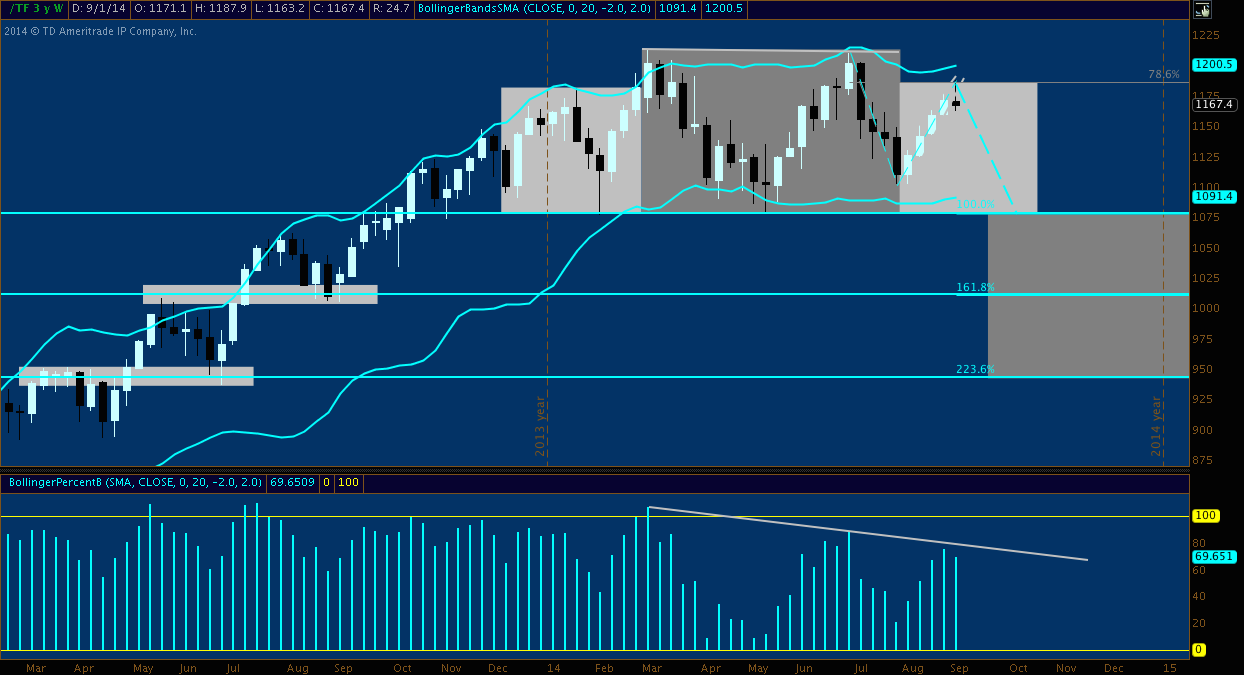
Scaling back another step, the potential significance of the reversal, throwback and wedge break becomes clear. Unless NFP Friday saves the day (something it does often, but less so of late), this week is creating a bearish harami star at key 78.6% fibonacci resistance. Look back at the balance of 2014, we see this occurs this advance mirrors January’s decline, building out what may be the right shoulder of a highly symmetrical Complex H&S Top.
If this is the start of a leg lower, we can construe this week as “B” in an ABCD that pushes Russell 2000 back to YTD lows near 1070-1080. if it’s not, a break above Wednesday’s high near 1190 will quickly negate. Below the 100% ABCD extension, the 161.8% near 1000-1010 (Q2-Q3 2013’s major price fulcrum) and 223.6% near 940-950 are the next major levels of concern. 940-950 offers a major confluence as the primary measured move objective of the Complex H&S (see dark gray square at far-right). Compounding the view TF’s latest (and third major) 2014 corrective rally may be culminating here is the negative momentum divergence from February and June’s tops above 1200 that may be confirming with a lower high here.
Russell 200 Mini Futures (TF) – Weekly: Potential Complex Head & Shoulders Top
End of the Cycle? Russell 2000’s Longer-Term Bullish Continuation and Bearish Reversal Scenarios
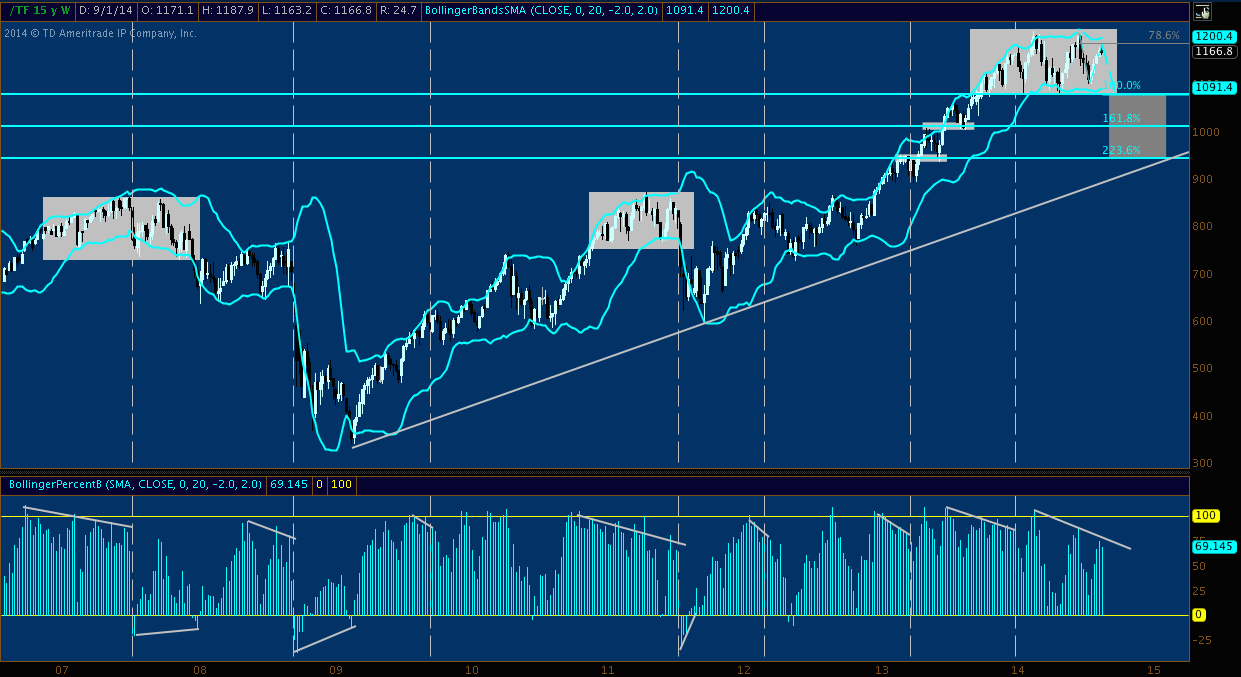
There are major longer-term implications here, as well. On TF’s weekly chart, 2014’s character as a consolidation period is plain. Everything that has occurred between it’s range boundaries of 1080-1220 is been noise on a cyclical basis. To this point, it is nothing more than a pause in-trend; and that primary trend is indisputably up. Simply put: a break held above 1220 would solidify 2014’s rectangle/lateral channel as a bullish continuation pattern and affirm the 5.5 year bull market advance. Longer-term investors and active traders alike should monitor this level closely. If a breakout occurs and the quality of the breakout holds up on volume and strong breadth, a fast move to 1350-1360 (essentially stacking the consolidation range on top of itself) is likely in the cards.
That said, any analyst or trader with experience beyond a moribund market compelled higher on the backs of a Fed-promulgated yield chase that is the mother of all moral hazard trades knows that such patterns can resolve lower.
Indeed, look no further than 2007 and 2011 for the best recent examples. Making a concession that pattern pareidolia is always an attendant risk: 2014 looks, trades and feels (wildly vacillating sentiment, major macro and policy risk, etc.) a lot like these periods. Note the momentum divergence mentioned above against it’s larger context. These divergences can be negated; but it is highly uncommon (for tops and bottoms, as displayed at 2008, 2009, and 2011’s bottoms).
Admittedly, technicians have been neck-deep in apparently “anomalies” and exceptions to the rule since 2011’s October bottom, and especially following the inception of QE3 in late 2012. Nonetheless, like the physical universe, markets obey their own immutable laws of motion. These laws can be “suspended” through ingenuity and artifice, but the energy that drives these fugue states – whether fuel cells or animal spirits – is finite. Entropy eventually takes hold. Markets do not have to conform to their history; but they often do, and no prudent risk manager will shirk long-established precedent for the irradiated koolaid of a “new normal”.
The bearish scenario could follow the path of A) a pullback to 1070-1080 and higher; B) the second major in-cycle pullback to trend line support near 940-950 (notice where 5.5. year trend line support cuts through) before resuming higher; or C) a cyclical peak, that brings additional declines, notably back to the 2007, 2011 highs near 860.
Russell 200 Mini Futures (TF) – Weekly: Is 2014 a Primary Top, Secondary Top; or Bullish Continuation?
Trade ’em Well.
Twitter: @andrewunknown
Author holds net short exposure to Russell 2000 the time of publication. Commentary provided is for educational purposes only and in no way constitutes trading or investment advice. Charts courtesy of TDAmeritrade/ThinkorSwim and TradingView.com


: Creating Bullish Divergence?")


