Over the last 30 years, there has been a widely held belief, supported by data, in the predictive powers of the “slope” of the yield curve. The slope of the yield curve is a simple calculation comparing interest rates of various maturity terms. Traditionally, the slope of the yield curve is measured by the difference between interest rates of shorter term government debt, such as the 3-month Treasury Bills or 2-year Treasury Notes, and long-term government debt such as 10-year Treasury Notes and 30-year Treasury Bonds.
A steep yield curve, where long term government yields are significantly higher than short ones, implies economic expansion in months and quarters ahead. A flat or inverted yield curve, where long term government yields are not much higher or are even lower than short term ones, implies economic weakness and heightened recession risks ahead.
The past is not always prologue for the future so we ask the following question: Do the normal rules apply when the Federal Reserve (Fed) has lowered the Federal Funds rate to unprecedented levels for over 7 years and quadrupled the money supply? Questioning the value of traditional analysis is not only appropriate, it is necessary, if one is to effectively perform economic analysis given the unique nature of central bank actions.
Traditional Yield Curve Analysis
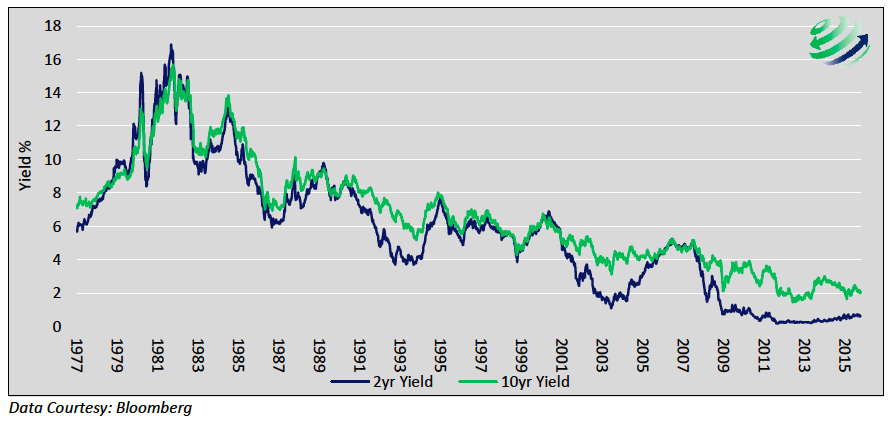
Below we graphically represent the slope of the yield curve and recessionary periods to demonstrate the predictive relationship. The first chart plots the yield on 2-year Treasury notes and the yield on 10-year Treasury notes. The subsequent chart shows the difference between 2-year Treasury Note yields and 10-year Treasury Note yields, otherwise known as the “2’s-10’s curve”. To highlight the predictive nature of the yield curve, periods where the curve was inverted are plotted in red and recessions are highlighted with yellow bars.
2-year and 10-year Treasury Note Yields
The 2’s-10’s Treasury Yield Curve and Recessionary Periods
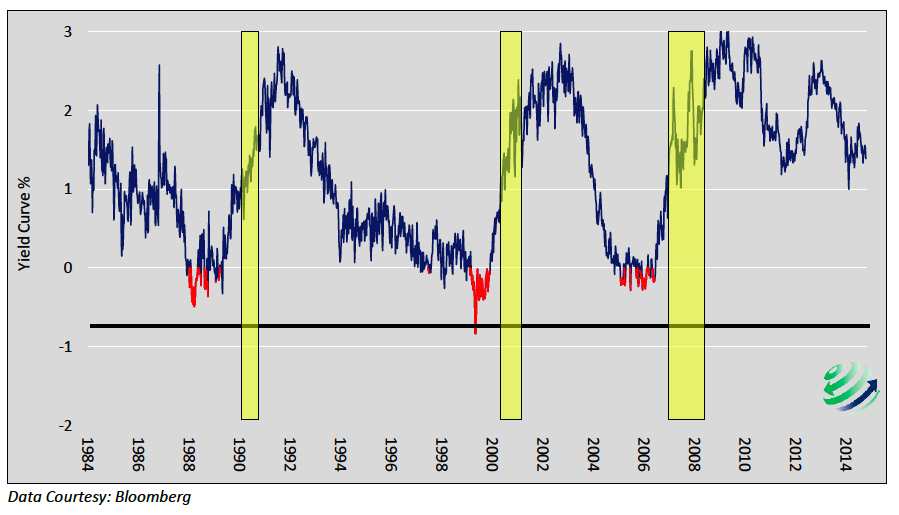
Based solely upon the precedent of the last 30-years and the slope of the curve today (1.42%), one might conclude that there is relatively little reason to worry about a pending U.S. recession. In fact, current levels are similar to those when recession typically ended and prolonged periods of economic growth began.
As proposed in the introduction, Federal Reserve monetary policy is far from normal. Investors therefore need to understand that the unprecedented nature of Fed policy and the fact that the Fed Funds rate has been pegged at zero since December 2008 likely plays a larger part in influencing the shape of the curve than in times past. This unprecedented posture by the Federal Reserve is distorting not only the price of money through interest rates but also economic activity.
continue reading on the next page…


