Shorter maturity instruments such as the 2-year Treasury note are heavily swayed by the monetary policy stance established by the Fed while longer maturity instruments such as the 10-year Treasury tend to be largely driven by the rate of inflation and economic activity. By keeping short rates artificially low through a zero Fed Funds target rate policy, the Fed is heavily influencing short-term interest rates and causing the yield curve to be artificially steep. One way to test this theory is to use the Taylor Rule as an alternative Fed Funds target guide.
The Taylor Rule
The Taylor Rule, proposed by Stanford economist John Taylor in 1993, sets forth a prescriptive policy benchmark for the Fed Funds target rate based upon the state of the economy using the rate of inflation and actual economic growth relative to potential growth. This formula not only suggests what Fed interest rate policy should be but also serves as a useful measure of the aggressiveness of prior Fed policy.
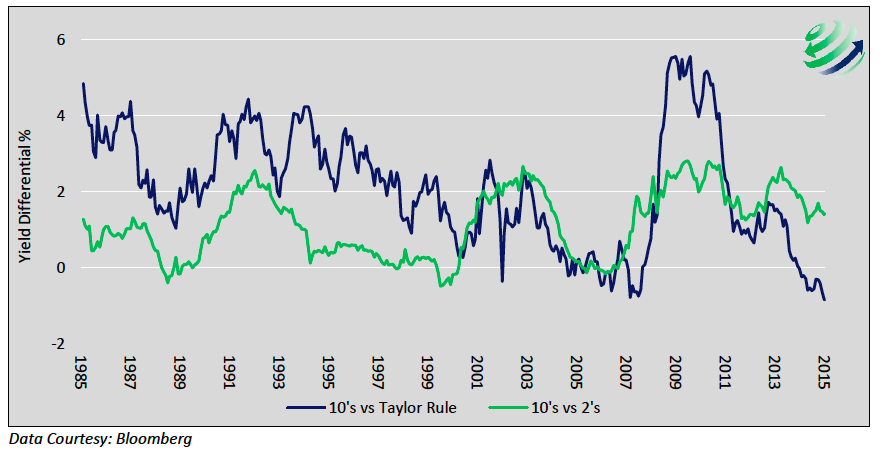
Currently, the Taylor rule suggests that the Fed Funds target rate should be approximately 2.85%. With current 2-year Treasury yields at 0.60% and 10-year Treasury yields at 2.02%, the 2’s-10’s curve is 1.42%. If the Fed were to follow the Taylor Rule and the Fed Funds rate were reset accordingly, the yield curve would become significantly inverted, with the assumption that 2-year yields rise pro-rata with Fed Funds as is typical. In fact, the yield curve would be more inverted than at any time in the last 30 years and signaling an imminent recession. The chart below compares the current 2’s-10’s curve versus a Taylor Rule-inspired curve.
Taylor Rule Inspired Yield Curve vs. Traditional Yield Curve
Net Interest Margin
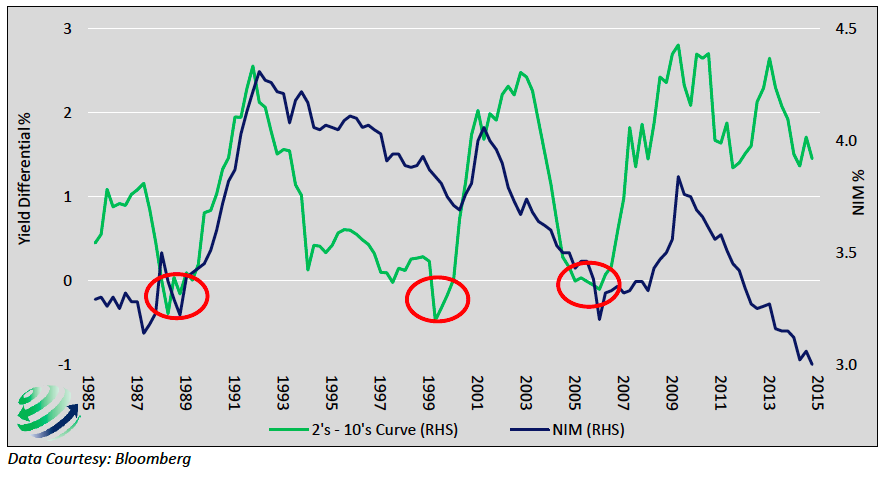
Another yield curve derived tool used to assess the economic outlook is the state of financial institutions’, predominately banks, net interest margins (NIM). Banks generate a substantial portion of their income from the difference between the yield at which they borrow and the yield at which they lend. The inputs to NIM from a financial statement perspective are interest income minus interest expense. Historically, when the yield curve flattens, the ability of banks to generate income is challenged because the rate at which banks borrow converges towards the yield earned on loans and investments (Net Interest Margin declines). When NIMs contract, banks tend to engage in less lending activity, constricting economic growth and adding further pressure on the slope of the yield curve to flatten. This self-reinforcing cycle is usually broken when the Fed lowers the Fed Funds rate, which tends to steepen the yield curve and increase NIMs. The chart below compares the relationship of the traditional 2’s-10’s curve and NIM. The red circles emphasize periods where the yield curve was inverted, which ultimately led to recessions.
Clearly a strong correlation exists between the slope of the yield curve and NIM. The chart also reflects that although the 2’s-10’s curve remains steep today, banks NIMs have declined to their lowest levels in over 30 years and are below those associated with an inverted yield curve preceding U.S. recessions.
NIM vs Traditional Yield Curve
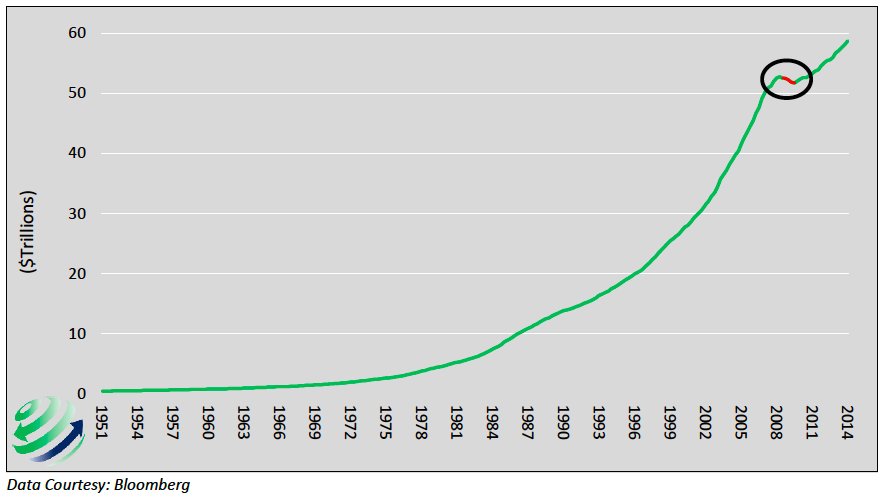
In the world of a zero interest rate policy, NIM may be a more valid indicator of future economic activity. In other words, economic forecasts based on the shape of the traditional curve may not be as relevant given the unprecedented monetary policy actions of the Federal Reserve. Very low levels of interest rates are squeezing bank profits which is one of the key drivers of lending activity and a primary determinant of economic activity. Growth of the U.S. economy, even at today’s below trend pace, is more dependent than ever on a continuation of credit growth. If bank lending activity is challenged as a result of declining NIM, it would stand to reason that NIM may serve as a useful indicator of potential economic weakness. The graph below serves as a reminder of what happened the only time credit growth declined in the last 65 years – the U.S. experienced the largest financial crisis since the Great Depression.
Total Outstanding Credit
Conclusion – Debt Drives Growth
Economic growth for the last 30 years has been increasingly funded by debt. For this scheme to continue, there must be increased incentives for the private sector to lend money. Since 1985 the incentive to lend, measured by NIM, has never been worse.
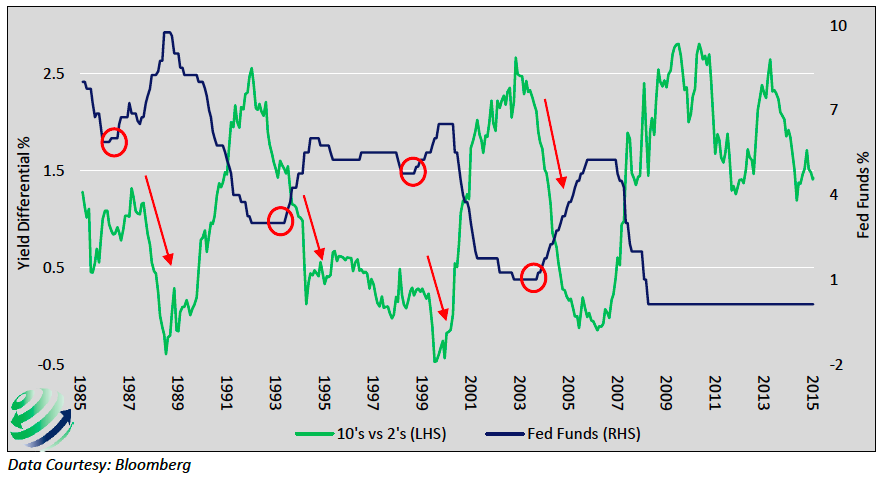
The Fed is currently contemplating raising short-term interest rates. If they follow through, the effect on NIM could slow economic growth. Historical periods of rate increases generally correspond with a flattening of the yield curve. The chart below highlights periods when the Fed initiated rate increases (red circles) and the corresponding reaction of the yield curve flatter (red arrows). Raising short-term rates, all else equal, would increase bank borrowing rates which would further reduce NIM.
Fed Funds Rate and Corresponding Yield Curve Changes
The bottom line is that Net Interest Margin and the Taylor Rule-adjusted curve are both flashing warning signs of economic recession, while the traditional yield curve signal is waving the all clear flag. Given the Fed actions of the last several years – sustained crisis policy of zero short term rates and multiple rounds of quantitative easing – it seems prudent to consider potential distortions to traditional indicators. Using the shape of the yield curve as an indicator for the economic outlook requires more supporting evidence for validation. In this case, NIM and the Taylor Rule-adjusted curve contradict the traditional curve’s signal for the economic outlook.
To the extent the Federal Reserve decides to increase interest rates, it should be apparent that such a move would be inconsistent with their prior actions. In fact, it may likely be a desperate effort to re-load the monetary policy gun as opposed to a signal of domestic economic strength. Not only is this a departure from the past this would lead many to question the Fed’s motives. It is worth keeping in mind that blind trust and confidence in the Fed has propelled many markets much higher than fundamentals justify.
Thanks for reading.
Twitter: @michaellebowitz
Any opinions expressed herein are solely those of the author, and do not in any way represent the views or opinions of any other person or entity.

: Showing Some Signs of Emerging Strength")
