Recently, I have with Arun Chopra on a new research adventure. We fuse together longer-term fundamental indicators with technical indicators to do historical studies. Today, I want to share one of our latest studies on Copper prices.
And, more importantly, I want to show how our work positions copper for a potential plunge lower.
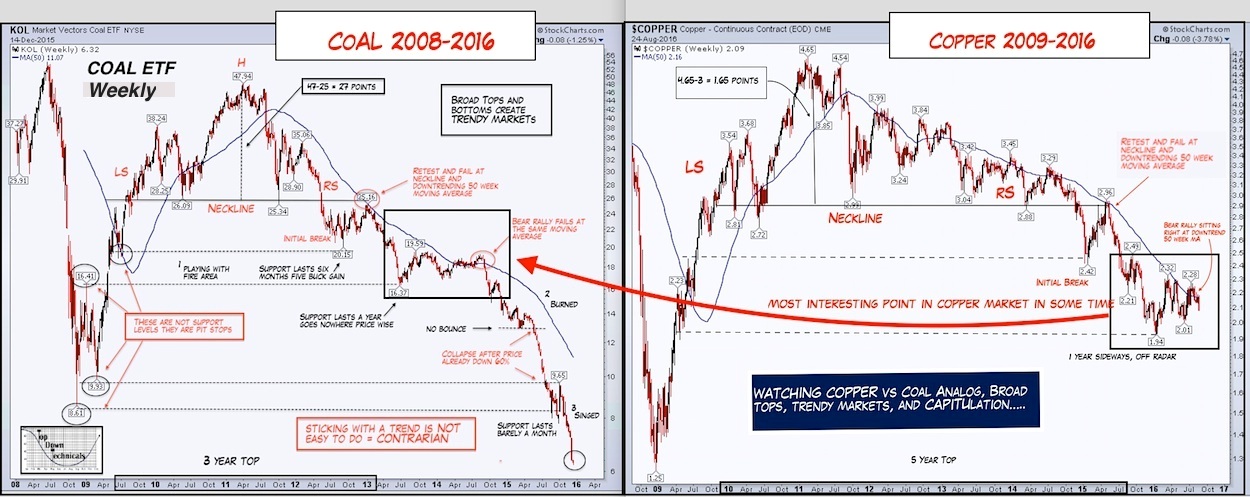
Looking at the annotated charts below, here are some observations (many compared against the backdrop of Coal’s price decline). If Copper’s decline “rhymes” with Coal’s, it could be headed much lower.
- Coal formed a broad top from 2009-2012 on massive post-crisis Chinese stimulus followed by Chinese tightening attempts to cool overheating economy.
- Coal broke its neckline in mid-2012 followed by a bear rally off support to the 50 week MA (a good trend barometer).
- Copper prices formed a similar top from 2010-2015, with a neckline break in early 2015 and bear rally to the 50 week MA in the early/mid 2016.
- They say so goes Dr. Copper so goes the market. But, is it so goes coal, so goes Dr. Copper in lagged fashion? This is the most interesting point in the copper market in some time as Copper tests its 50 week MA trying avoid a “coal-ly” outcome.
Coal ETF (KOL) vs Copper Prices Chart (click on chart to enlarge)
Thanks for reading and best of luck out there.
Twitter: @JBL73
The authors may have positions in mentioned securities by the time of publication. Any opinions expressed herein are solely those of the author, and do not in any way represent the views or opinions of any other person or entity.


")
 Rolling Over At Key Fibonacci Level?")