I am currently vacationing in Italy and as I take in the sights and tastes of my homeland I can’t help but ponder what markets are doing and where they lie as I am absent from the day to day grind.
The Consumer Staples sector is one that I like to look at to get a quick snapshot of where the market is in terms of risk-on or risk-off sentiment. After reaching all time highs recently, the Consumer Staples Sector ETF (XLP) took a rest this week following a very strong month.
Since Staples are where money managers tend to hide during market downturns the sector’s performance can be useful in evaluating market strength and the resiliency of the current uptrend, especially in view of the impressive reversal stocks have staged from a very difficult beginning of the year.
Let’s have a look at some charts.
Below is a daily chart of the Consumer Staples Sector (XLP). As you can see the ETF staged a reversal after reaching all time highs on March 17th and has come in a bit since then.
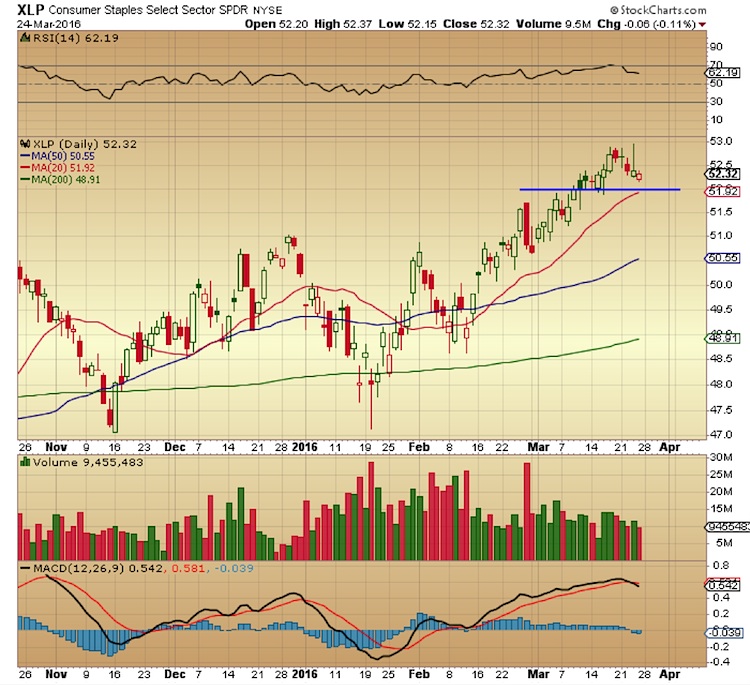
The uptrend is still valid as long as the stock remains above $52 where structural support meets the 20day SMA. This could be a good spot to place a stop if you are long here. The XLP has been in an uptrend since Jan. 20th and then went on to stage an 8% rally off the Feb. 11th lows. Some consolidation here is not necessarily a bad thing.
Now let’s take a look at the weekly chart.
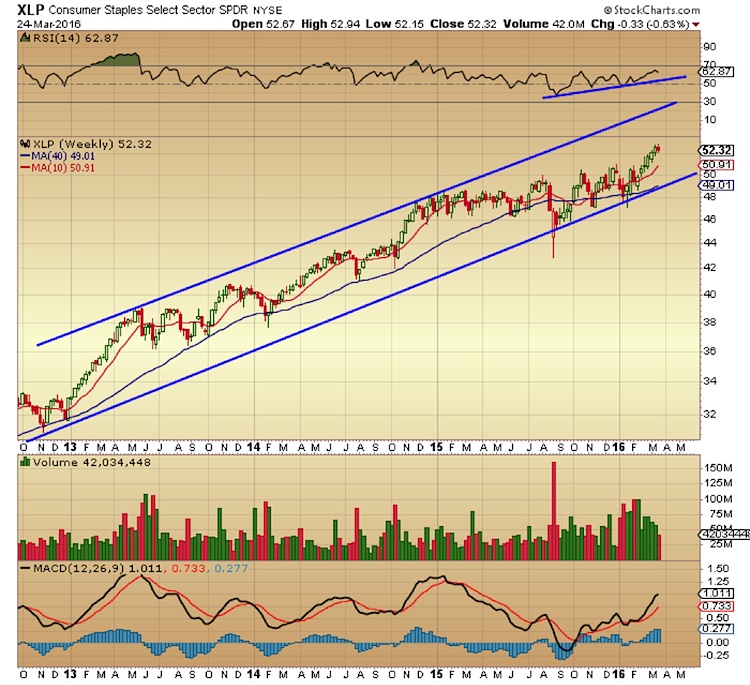
The weekly chart for the Consumer Staples Sector also shows a stall following all time highs although it is still within this well defined three year rising channel. It could be due for a rest in the near term but, as mentioned earlier, I would be cautious in going short here. While it’s true that Staples have been rallying hand in hand with the broader stock market indexes since the 2/11 lows, it’s also true that the sector’s defensive nature emerged quite clearly at the end of 2015 and into early 2016 as the market corrected. XLP lost 7.6% from its December highs while the S&P500 ETF, SPY corrected over 14% from its November 3rd highs.
In this regard, let’s take a look at a daily chart of XLP relative to SPY.
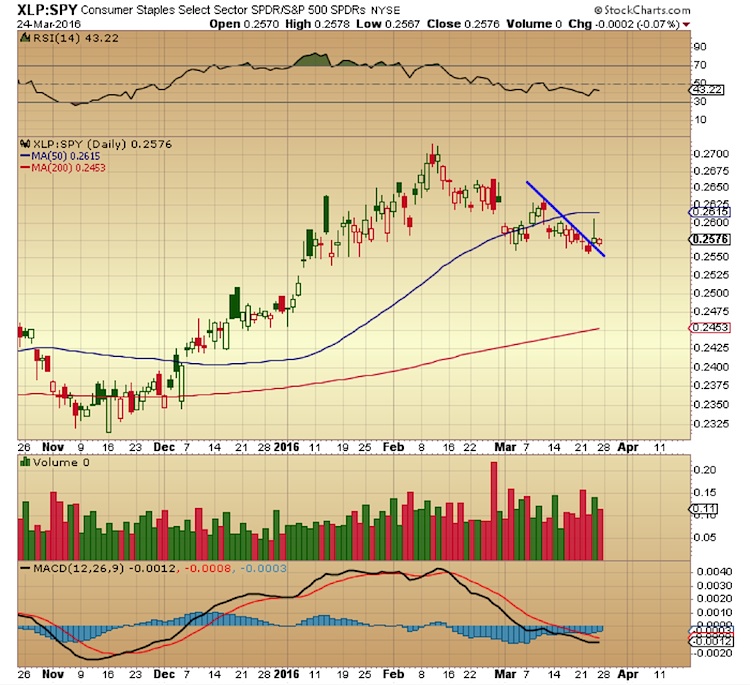
As you can see from the chart above, on Wednesday the XLP relative to SPY broke above a short term downtrend line that began on March 10th. Although the bears were able to push the break out back to down into the close, the inverted hammer that emerged on Wednesday still managed a close above the said downtrend line and held those levels on Thursday with a flat close.
As we come out of a holiday shortened week it’ll be interesting to see whether the market continues to proceed with a risk-on stance. For now it seems we’ve developed some short term bearish momentum but as mentioned earlier, I’d be careful in jumping short here until price confirms.
The market has gone out of its way to make it unclear as to whether we are currently experiencing an intermediate trend bounce within a new bear market or whether this is simply another V shaped recovery from a correction as we saw in the September-October period of last year. There are many ongoing debates on this subject out there with very different opinions on where the market currently stands within a longer term time frame and whether the seven year bull market is still in place.
Several “See It market” contributors have come up with some really great reads over the last couple of days. I would highly recommend taking a look at those to get a more detailed breakdown of technical levels and more comprehensive market analysis.
Although the Consumer Staples Sector performance should obviously not be taken as a buy or sell signal on its own, it can, like several other sectors, provide hints on where risk appetite lies among market participants. It is, therefore, worthwhile to keep an eye on the developments in price action for this sector and add it to your broader based market overviews in the days and weeks to come.
Thanks for reading!
Further reading from Marco: “Inside The ECB Decision And What It May Mean For Stocks“
Twitter: @DDCapitalFund
The author does not have a position in the mentioned securities at the time of publication. Any opinions expressed herein are solely those of the author, and do not in any way represent the views or opinions of any other person or entity.


: Creating Bullish Divergence?")


