 By Andrew Nyquist
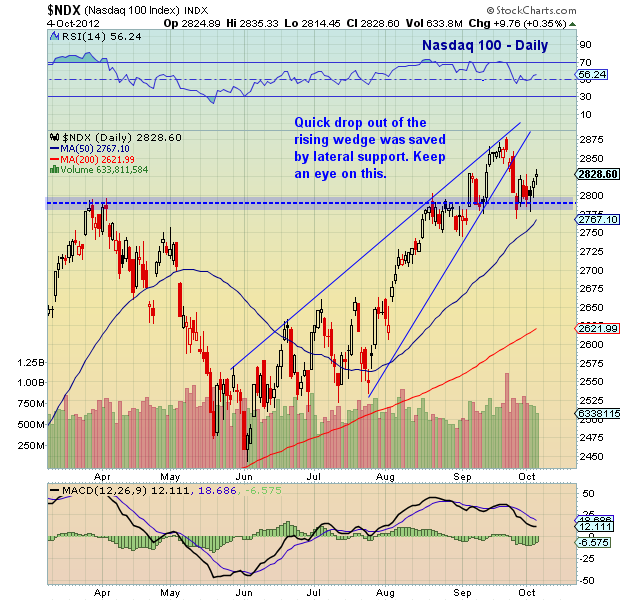
After slipping out of a mini rising wedge pattern in August, the Nasdaq 100 continued it’s ascent higher, forming another more macro rising wedge.
Rising wedges are tricky, partly because the breaks are sudden, and also because they aren’t always a good sign of trend change. But as they form, they do send a message to equity investors to be on guard and disciplined.
The latest slip out of the rising wedge pattern resulted in a quick 100 pt drop in the Nasdaq 100. Fortunately, lateral support caught the fall and allowed the index to neutralize prior to a recent 3 day run higher. Holding support is numero uno for bulls. Follow through and volume are also key.
Trade safe, trade disciplined.
More charts found here.
Nasdaq 100 (NDX) technical chart as of October 4, 2012. Nasdaq 100 chart with rising wedge pattern and lateral support. Nasdaq 100 October technical analysis.
———————————————————
Twitter: @andrewnyquist and @seeitmarket Facebook: See It Market
No position in any of the securities mentioned at the time of publication.
Any opinions expressed herein are solely those of the author, and do not in any way represent the views or opinions of his employer or any other person or entity.


